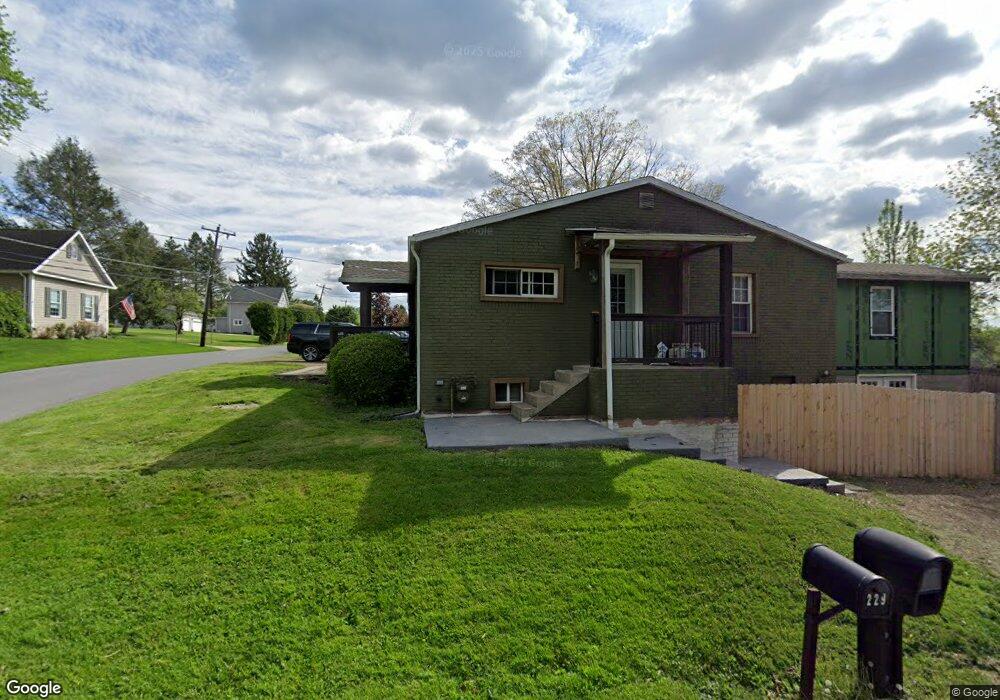
210 3rd Ave Homer City, PA 15748
Estimated Value: $129,000 - $196,000
2
Beds
1
Bath
1,260
Sq Ft
$122/Sq Ft
Est. Value
About This Home
This home is located at 210 3rd Ave, Homer City, PA 15748 and is currently estimated at $154,031, approximately $122 per square foot. 210 3rd Ave is a home located in Indiana County with nearby schools including Homer-Center Elementary School and Homer-Center Junior/Senior High School.
Ownership History
Date
Name
Owned For
Owner Type
Purchase Details
Closed on
May 6, 2011
Sold by
Sasala Christopher and Sasala Joy
Bought by
Tanner Erik W and Tanner Jenna L
Current Estimated Value
Home Financials for this Owner
Home Financials are based on the most recent Mortgage that was taken out on this home.
Original Mortgage
$77,625
Interest Rate
4.62%
Mortgage Type
New Conventional
Purchase Details
Closed on
Nov 20, 2009
Sold by
Mtglq Investors Lp
Bought by
Sasala Christopher and Sasala Joy
Purchase Details
Closed on
Nov 3, 2008
Sold by
Popular Financial Services Llc
Bought by
Mtglo Investors Lp
Create a Home Valuation Report for This Property
The Home Valuation Report is an in-depth analysis detailing your home's value as well as a comparison with similar homes in the area
Home Values in the Area
Average Home Value in this Area
Purchase History
| Date | Buyer | Sale Price | Title Company |
|---|---|---|---|
| Tanner Erik W | $75,000 | None Available | |
| Sasala Christopher | $50,000 | None Available | |
| Mtglo Investors Lp | -- | None Available |
Source: Public Records
Mortgage History
| Date | Status | Borrower | Loan Amount |
|---|---|---|---|
| Previous Owner | Tanner Erik W | $77,625 |
Source: Public Records
Tax History Compared to Growth
Tax History
| Year | Tax Paid | Tax Assessment Tax Assessment Total Assessment is a certain percentage of the fair market value that is determined by local assessors to be the total taxable value of land and additions on the property. | Land | Improvement |
|---|---|---|---|---|
| 2025 | $2,210 | $88,200 | $17,700 | $70,500 |
| 2024 | $2,175 | $88,200 | $17,700 | $70,500 |
| 2023 | $2,046 | $88,200 | $17,700 | $70,500 |
| 2022 | $2,024 | $88,200 | $17,700 | $70,500 |
| 2021 | $2,024 | $88,200 | $17,700 | $70,500 |
| 2020 | $1,983 | $88,200 | $17,700 | $70,500 |
| 2018 | $1,959 | $88,200 | $17,700 | $70,500 |
| 2017 | $1,607 | $88,200 | $17,700 | $70,500 |
| 2016 | -- | $88,200 | $17,700 | $70,500 |
| 2015 | -- | $9,020 | $1,280 | $7,740 |
| 2014 | -- | $9,020 | $1,280 | $7,740 |
Source: Public Records
Map
Nearby Homes