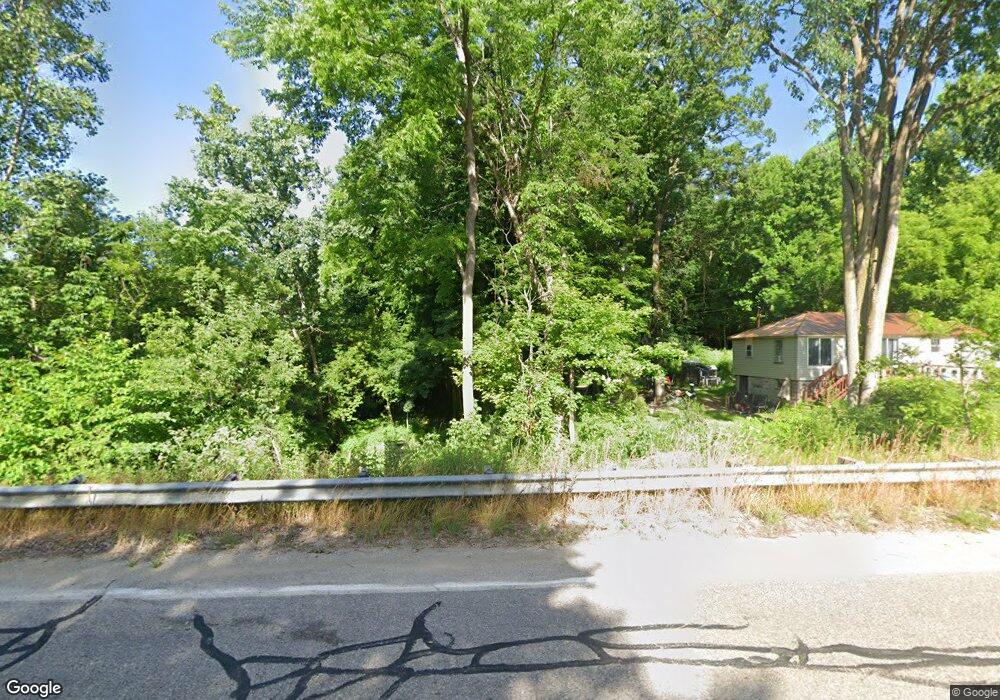
210 40th St Allegan, MI 49010
Estimated Value: $51,000 - $184,000
3
Beds
1
Bath
920
Sq Ft
$119/Sq Ft
Est. Value
About This Home
This home is located at 210 40th St, Allegan, MI 49010 and is currently estimated at $109,920, approximately $119 per square foot. 210 40th St is a home located in Allegan County with nearby schools including Pine Trails Elementary School, L.E. White Middle School, and Allegan High School.
Ownership History
Date
Name
Owned For
Owner Type
Purchase Details
Closed on
Sep 28, 2022
Sold by
Myers Janeen Alise
Bought by
Myers Sara Lee
Current Estimated Value
Purchase Details
Closed on
Sep 21, 2015
Sold by
Antkoviak Peter and Antkoviak Nancy A
Bought by
Myers Janeen A
Home Financials for this Owner
Home Financials are based on the most recent Mortgage that was taken out on this home.
Original Mortgage
$22,000
Interest Rate
6%
Mortgage Type
Seller Take Back
Purchase Details
Closed on
Jun 18, 2004
Sold by
Adams Larry D and Adams Deborah M
Bought by
Antkoviak Ii Peter and Antkoviak Nancy A
Purchase Details
Closed on
Dec 1, 1990
Bought by
Gifford and Adams
Create a Home Valuation Report for This Property
The Home Valuation Report is an in-depth analysis detailing your home's value as well as a comparison with similar homes in the area
Home Values in the Area
Average Home Value in this Area
Purchase History
| Date | Buyer | Sale Price | Title Company |
|---|---|---|---|
| Myers Sara Lee | -- | -- | |
| Myers Janeen | $30,000 | -- | |
| Myers Janeen A | $30,000 | None Available | |
| Antkoviak Ii Peter | $5,000 | -- | |
| Gifford | $27,000 | -- |
Source: Public Records
Mortgage History
| Date | Status | Borrower | Loan Amount |
|---|---|---|---|
| Previous Owner | Myers Janeen A | $22,000 |
Source: Public Records
Tax History Compared to Growth
Tax History
| Year | Tax Paid | Tax Assessment Tax Assessment Total Assessment is a certain percentage of the fair market value that is determined by local assessors to be the total taxable value of land and additions on the property. | Land | Improvement |
|---|---|---|---|---|
| 2025 | $1,890 | $45,600 | $15,000 | $30,600 |
| 2024 | -- | $39,000 | $13,000 | $26,000 |
| 2023 | $450 | $33,000 | $11,000 | $22,000 |
| 2022 | $450 | $31,000 | $10,600 | $20,400 |
| 2021 | $450 | $27,500 | $9,300 | $18,200 |
| 2020 | $450 | $23,600 | $8,300 | $15,300 |
| 2019 | $0 | $21,300 | $7,000 | $14,300 |
| 2018 | $0 | $21,100 | $7,000 | $14,100 |
| 2017 | $0 | $19,000 | $5,500 | $13,500 |
| 2016 | $0 | $15,400 | $4,000 | $11,400 |
| 2015 | -- | $15,400 | $15,400 | $0 |
| 2014 | -- | $16,300 | $16,300 | $0 |
| 2013 | -- | $15,600 | $4,800 | $10,800 |
Source: Public Records
Map
Nearby Homes