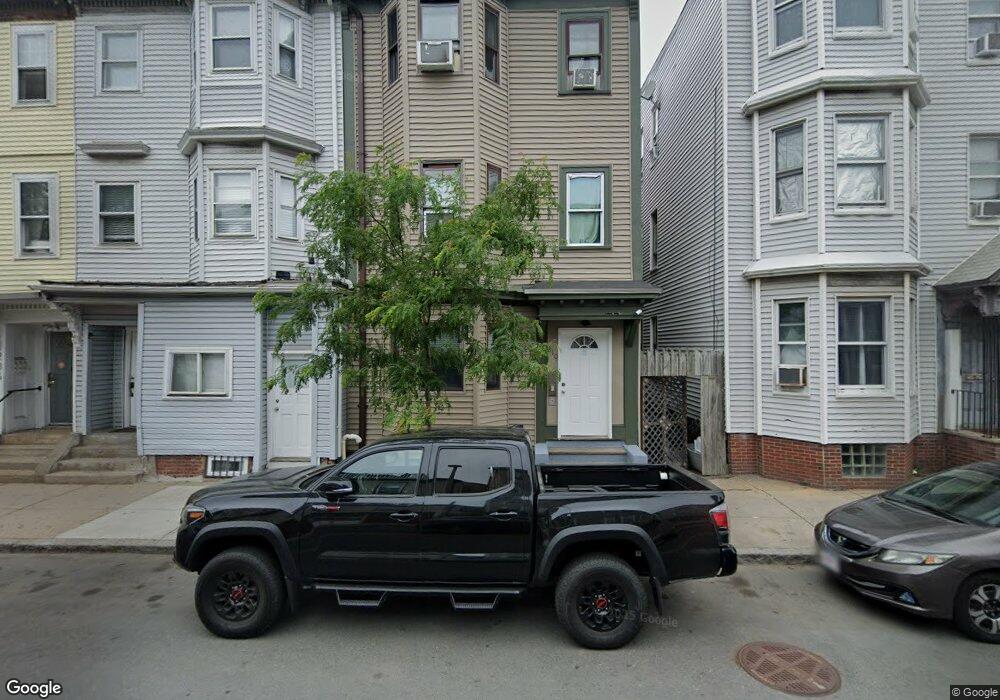
210 Bennington St Boston, MA 02128
Central Maverick Square-Paris Street NeighborhoodEstimated Value: $846,000 - $1,088,000
6
Beds
3
Baths
1,764
Sq Ft
$549/Sq Ft
Est. Value
About This Home
This home is located at 210 Bennington St, Boston, MA 02128 and is currently estimated at $967,658, approximately $548 per square foot. 210 Bennington St is a home located in Suffolk County with nearby schools including Excel Academy East Boston and East Boston Central Catholic School.
Ownership History
Date
Name
Owned For
Owner Type
Purchase Details
Closed on
Aug 20, 2001
Sold by
Martinez Jose
Bought by
Melendez Josue
Current Estimated Value
Home Financials for this Owner
Home Financials are based on the most recent Mortgage that was taken out on this home.
Original Mortgage
$311,382
Interest Rate
7.16%
Mortgage Type
Purchase Money Mortgage
Purchase Details
Closed on
Jan 31, 2001
Sold by
Susi Vincent and Susi Nino
Bought by
Martinez Francisco and Martinez Jose
Purchase Details
Closed on
Sep 24, 1999
Sold by
Barresi John A
Bought by
Susi Vincent V and Susi Nino
Purchase Details
Closed on
Jan 4, 1995
Sold by
Peace Prop Inc
Bought by
Barresi John A
Purchase Details
Closed on
Aug 2, 1994
Sold by
Fhlmc
Bought by
Peace Properties Inc
Purchase Details
Closed on
May 24, 1994
Sold by
Truong Ngoc T and Truong Fhlmc
Bought by
Fhlmc
Create a Home Valuation Report for This Property
The Home Valuation Report is an in-depth analysis detailing your home's value as well as a comparison with similar homes in the area
Home Values in the Area
Average Home Value in this Area
Purchase History
| Date | Buyer | Sale Price | Title Company |
|---|---|---|---|
| Melendez Josue | $315,000 | -- | |
| Martinez Francisco | $250,000 | -- | |
| Susi Vincent V | $163,762 | -- | |
| Barresi John A | $14,000 | -- | |
| Peace Properties Inc | $10,000 | -- | |
| Fhlmc | $47,228 | -- |
Source: Public Records
Mortgage History
| Date | Status | Borrower | Loan Amount |
|---|---|---|---|
| Open | Fhlmc | $316,050 | |
| Closed | Fhlmc | $311,382 |
Source: Public Records
Tax History Compared to Growth
Tax History
| Year | Tax Paid | Tax Assessment Tax Assessment Total Assessment is a certain percentage of the fair market value that is determined by local assessors to be the total taxable value of land and additions on the property. | Land | Improvement |
|---|---|---|---|---|
| 2025 | $10,282 | $887,900 | $196,500 | $691,400 |
| 2024 | $9,327 | $855,700 | $205,000 | $650,700 |
| 2023 | $9,099 | $847,200 | $203,000 | $644,200 |
| 2022 | $8,456 | $777,200 | $186,200 | $591,000 |
| 2021 | $8,293 | $777,200 | $186,200 | $591,000 |
| 2020 | $7,096 | $672,000 | $207,300 | $464,700 |
| 2019 | $6,322 | $599,800 | $124,800 | $475,000 |
| 2018 | $5,611 | $535,400 | $124,800 | $410,600 |
| 2017 | $4,929 | $465,400 | $124,800 | $340,600 |
| 2016 | $4,452 | $404,700 | $124,800 | $279,900 |
| 2015 | $4,041 | $333,700 | $94,000 | $239,700 |
| 2014 | $3,651 | $290,200 | $94,000 | $196,200 |
Source: Public Records
Map
Nearby Homes
- 160 Putnam St
- 326 Chelsea St Unit 3
- 301 Saratoga St Unit 2
- 89 Prescott St Unit C
- 125 Putnam St
- 403-405 Saratoga St
- 223 Saratoga St Unit 203
- 98 Prescott St Unit 1
- 219 Saratoga St Unit 2
- 219 Saratoga St Unit PH-S
- 421 Saratoga St Unit 4A
- 421 Saratoga St Unit 1
- 421 Saratoga St Unit 7
- 421 Saratoga St Unit 3
- 421 Saratoga St Unit 5A
- 421 Saratoga St Unit 8
- 107 Putnam St Unit 3
- 157 Princeton St Unit 1
- 426 Saratoga St
- 398 Bremen St Unit 2
- 210 Bennington St Unit 2
- 208 Bennington St
- 212 Bennington St
- 212 Bennington St Unit 2
- 212 Bennington St Unit 1
- 206 Bennington St
- 148 Putnam St Unit 1
- 148 Putnam St
- 214 Bennington St
- 214 Bennington St Unit 3
- 214 Bennington St Unit 2
- 204 Bennington St
- 146 Putnam St
- 216 Bennington St
- 202 Bennington St
- 142 Putnam St
- 226 Bennington St
- 150 Putnam St
- 311 Saratoga St
- 311 Saratoga St