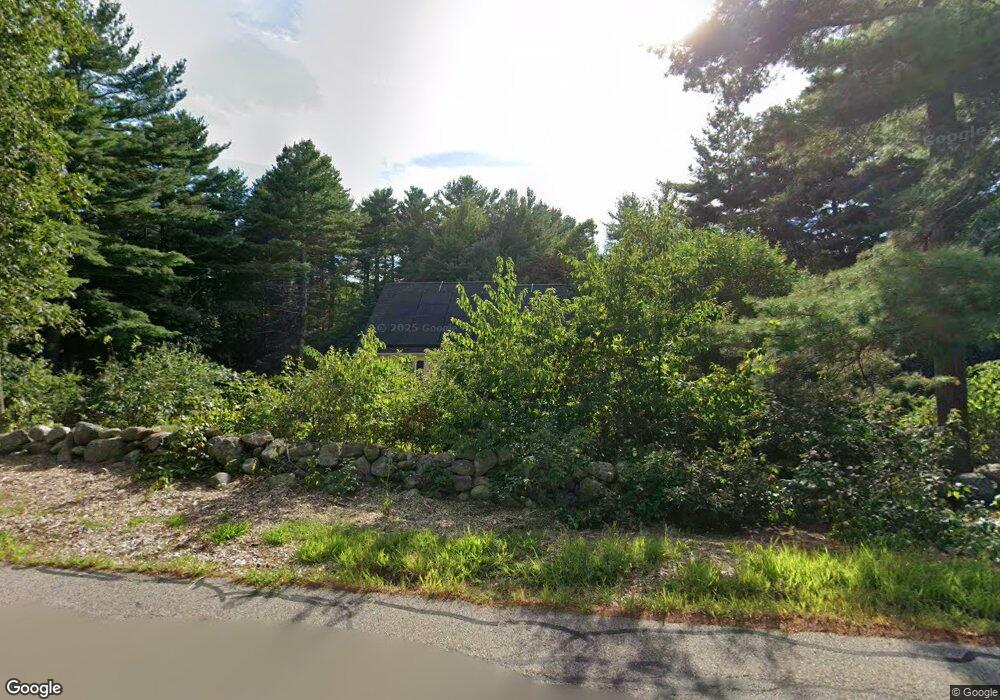
210 Berry St Wrentham, MA 02093
Estimated Value: $604,000 - $831,000
3
Beds
2
Baths
1,657
Sq Ft
$429/Sq Ft
Est. Value
About This Home
This home is located at 210 Berry St, Wrentham, MA 02093 and is currently estimated at $710,354, approximately $428 per square foot. 210 Berry St is a home located in Norfolk County with nearby schools including Delaney Elementary School and Charles E Roderick.
Ownership History
Date
Name
Owned For
Owner Type
Purchase Details
Closed on
Jun 29, 1998
Sold by
Renner Eric F and Renner Mary E
Bought by
Malacaria Robert J and Malacaria Sheila A
Current Estimated Value
Home Financials for this Owner
Home Financials are based on the most recent Mortgage that was taken out on this home.
Original Mortgage
$160,000
Outstanding Balance
$32,999
Interest Rate
7.09%
Mortgage Type
Purchase Money Mortgage
Estimated Equity
$677,355
Create a Home Valuation Report for This Property
The Home Valuation Report is an in-depth analysis detailing your home's value as well as a comparison with similar homes in the area
Home Values in the Area
Average Home Value in this Area
Purchase History
| Date | Buyer | Sale Price | Title Company |
|---|---|---|---|
| Malacaria Robert J | $90,000 | -- |
Source: Public Records
Mortgage History
| Date | Status | Borrower | Loan Amount |
|---|---|---|---|
| Open | Malacaria Robert J | $160,000 |
Source: Public Records
Tax History Compared to Growth
Tax History
| Year | Tax Paid | Tax Assessment Tax Assessment Total Assessment is a certain percentage of the fair market value that is determined by local assessors to be the total taxable value of land and additions on the property. | Land | Improvement |
|---|---|---|---|---|
| 2025 | $7,986 | $689,000 | $288,500 | $400,500 |
| 2024 | $7,477 | $623,100 | $288,500 | $334,600 |
| 2023 | $7,235 | $573,300 | $262,400 | $310,900 |
| 2022 | $7,018 | $513,400 | $255,600 | $257,800 |
| 2021 | $6,808 | $483,900 | $238,900 | $245,000 |
| 2020 | $6,757 | $474,200 | $182,500 | $291,700 |
| 2019 | $6,230 | $441,200 | $164,300 | $276,900 |
| 2018 | $5,880 | $412,900 | $164,100 | $248,800 |
| 2017 | $5,761 | $404,300 | $160,900 | $243,400 |
| 2016 | $5,642 | $395,100 | $156,300 | $238,800 |
| 2015 | $5,664 | $378,100 | $150,200 | $227,900 |
| 2014 | $5,571 | $363,900 | $144,500 | $219,400 |
Source: Public Records
Map
Nearby Homes
- 1204 South St
- 1222 South St
- 4 Munroe Dr
- 12 Grant St
- 791 South St Unit 5
- 387 South St
- 19 Chestnut Lot 0
- 50 Green St
- 44 Maple Terrace Unit 44
- 80 Willow Ln
- 160 Washington St Unit 36
- 158 Washington St
- 126 Washington St
- 130 Washington St
- 124 Washington St
- 29 Broad St
- Lot 1 - Blueberry 2 Car Plan at King Philip Estates
- Lot 8 - Blueberry 2 Car Plan at King Philip Estates
- Lot 5 - Hughes 2 car Plan at King Philip Estates
- Lot 6 - Blueberry 3 Car Plan at King Philip Estates