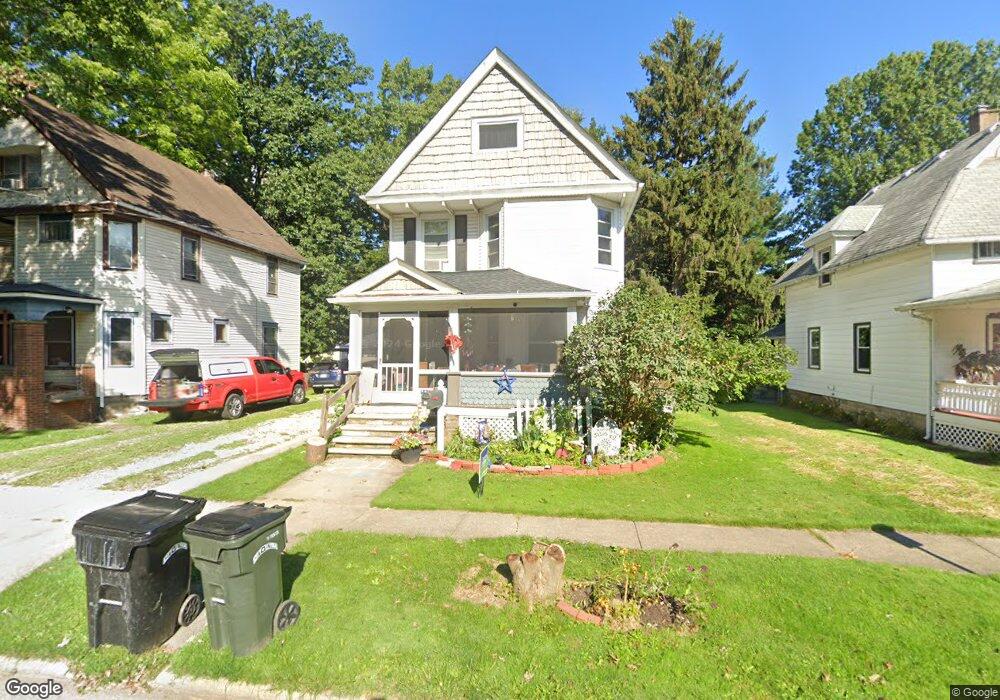
210 Blaine St Elyria, OH 44035
Estimated Value: $137,000 - $145,305
3
Beds
1
Bath
1,480
Sq Ft
$94/Sq Ft
Est. Value
About This Home
This home is located at 210 Blaine St, Elyria, OH 44035 and is currently estimated at $139,826, approximately $94 per square foot. 210 Blaine St is a home located in Lorain County with nearby schools including Eastern Heights Middle School, Elyria High School, and Constellation Schools: Elyria Community Elementary.
Ownership History
Date
Name
Owned For
Owner Type
Purchase Details
Closed on
Nov 8, 2001
Sold by
Lorain National Bank Tr
Bought by
Hawkey Eugene C and Hawkey Tammy M
Current Estimated Value
Home Financials for this Owner
Home Financials are based on the most recent Mortgage that was taken out on this home.
Original Mortgage
$83,588
Outstanding Balance
$32,670
Interest Rate
6.72%
Mortgage Type
FHA
Estimated Equity
$107,156
Create a Home Valuation Report for This Property
The Home Valuation Report is an in-depth analysis detailing your home's value as well as a comparison with similar homes in the area
Home Values in the Area
Average Home Value in this Area
Purchase History
| Date | Buyer | Sale Price | Title Company |
|---|---|---|---|
| Hawkey Eugene C | $84,900 | Chicago Title Insurance Comp |
Source: Public Records
Mortgage History
| Date | Status | Borrower | Loan Amount |
|---|---|---|---|
| Open | Hawkey Eugene C | $83,588 |
Source: Public Records
Tax History
| Year | Tax Paid | Tax Assessment Tax Assessment Total Assessment is a certain percentage of the fair market value that is determined by local assessors to be the total taxable value of land and additions on the property. | Land | Improvement |
|---|---|---|---|---|
| 2024 | $2,081 | $42,921 | $4,844 | $38,077 |
| 2023 | $1,889 | $33,824 | $5,376 | $28,448 |
| 2022 | $1,882 | $33,824 | $5,376 | $28,448 |
| 2021 | $1,887 | $33,824 | $5,376 | $28,448 |
| 2020 | $1,815 | $28,940 | $4,600 | $24,340 |
| 2019 | $1,804 | $28,940 | $4,600 | $24,340 |
| 2018 | $1,603 | $28,940 | $4,600 | $24,340 |
| 2017 | $1,400 | $21,490 | $5,050 | $16,440 |
| 2016 | $1,382 | $21,490 | $5,050 | $16,440 |
| 2015 | $1,297 | $21,490 | $5,050 | $16,440 |
| 2014 | $1,269 | $21,280 | $5,000 | $16,280 |
| 2013 | $1,258 | $21,280 | $5,000 | $16,280 |
Source: Public Records
Map
Nearby Homes
Your Personal Tour Guide
Ask me questions while you tour the home.