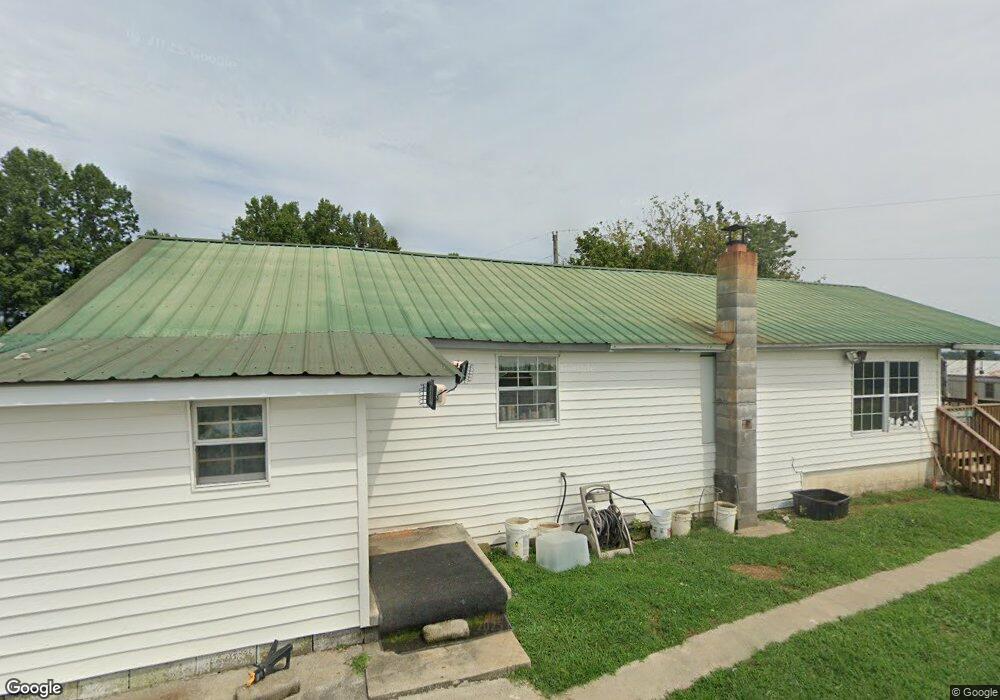
210 Boyd Sharp Ln La Follette, TN 37766
Estimated Value: $161,128 - $295,000
Studio
1
Bath
1,098
Sq Ft
$223/Sq Ft
Est. Value
About This Home
This home is located at 210 Boyd Sharp Ln, La Follette, TN 37766 and is currently estimated at $245,032, approximately $223 per square foot. 210 Boyd Sharp Ln is a home located in Campbell County.
Ownership History
Date
Name
Owned For
Owner Type
Purchase Details
Closed on
Mar 2, 2020
Sold by
Miller Terry Lynn and Miller Boyd Scott
Bought by
Miller Terry Lynn and Miller Bernice
Current Estimated Value
Purchase Details
Closed on
Jun 29, 2016
Sold by
Sharp Boyd
Bought by
Jo Sharp Nannie and Miller Terry Lynn
Purchase Details
Closed on
May 20, 1961
Bought by
Sharp Boyd
Create a Home Valuation Report for This Property
The Home Valuation Report is an in-depth analysis detailing your home's value as well as a comparison with similar homes in the area
Home Values in the Area
Average Home Value in this Area
Purchase History
| Date | Buyer | Sale Price | Title Company |
|---|---|---|---|
| Miller Terry Lynn | -- | None Available | |
| Jo Sharp Nannie | -- | -- | |
| Sharp Nannie Jo | -- | -- | |
| Sharp Boyd | -- | -- |
Source: Public Records
Tax History
| Year | Tax Paid | Tax Assessment Tax Assessment Total Assessment is a certain percentage of the fair market value that is determined by local assessors to be the total taxable value of land and additions on the property. | Land | Improvement |
|---|---|---|---|---|
| 2025 | $444 | $36,525 | $13,000 | $23,525 |
| 2024 | $444 | $36,525 | $13,000 | $23,525 |
| 2023 | $433 | $20,950 | $10,775 | $10,175 |
| 2022 | $433 | $20,950 | $10,775 | $10,175 |
| 2021 | $433 | $20,950 | $10,775 | $10,175 |
| 2020 | $2,198 | $20,950 | $10,775 | $10,175 |
| 2019 | $388 | $18,775 | $7,625 | $11,150 |
| 2018 | $428 | $19,000 | $7,425 | $11,575 |
| 2017 | $428 | $19,000 | $7,425 | $11,575 |
| 2016 | $428 | $19,000 | $7,425 | $11,575 |
| 2015 | $378 | $19,000 | $7,425 | $11,575 |
| 2014 | -- | $19,000 | $7,425 | $11,575 |
| 2013 | -- | $19,000 | $7,425 | $11,575 |
Source: Public Records
Map
Nearby Homes
- 0 Grantsboro Rd
- 0 Clearwater View Ln Unit 1317048
- 0 Unnamed Rd
- 0 Lot 287 Villages Ll Unit 1326937
- 0 Whitman Hollow Rd Unit 1329000
- 0 Rainbow View Rd
- 0 Country Oaks Ln
- 0 Poplar Dr Unit 58
- Lot 52 E Poplar Ln
- 125 Old Hearth
- 42 Old Hearth
- 124 Old Hearth
- 303 Tar Town Hollow Ln
- 0 E Dogwood Trail Unit 1329771
- 299 Tar Town Hollow Ln
- Tract 1 E Dogwood Tr
- 113 Laurel Way
- 106 Laurel Way
- 0 Old Glory Ln Unit 1296916
- 711 Jim Lee Ridge Rd
- 224 Boyd Sharp Ln
- 132 Boyd Sharp Ln
- 137 Chestnut Stump Rd
- 137 Chestnut Stump Rd
- 258 Coleman Ln
- 204 Coleman Ln
- 255 Chestnut Stump Rd
- 524 Grantsboro Rd
- 224 Boyd Sharp Ln
- 409 Grantsboro Rd
- 127 Axley Rd
- 953-929 Grantsboro Rd
- 151 Sharp Ln
- 349 Chestnut Stump Rd
- 153 Leroy Day Ln
- 584 Grantsboro Rd
- 121 Leroy Day Ln
- 595 Grantsboro Rd
- 692 Grantsboro Rd
- 357 Grantsboro Rd
Your Personal Tour Guide
Ask me questions while you tour the home.