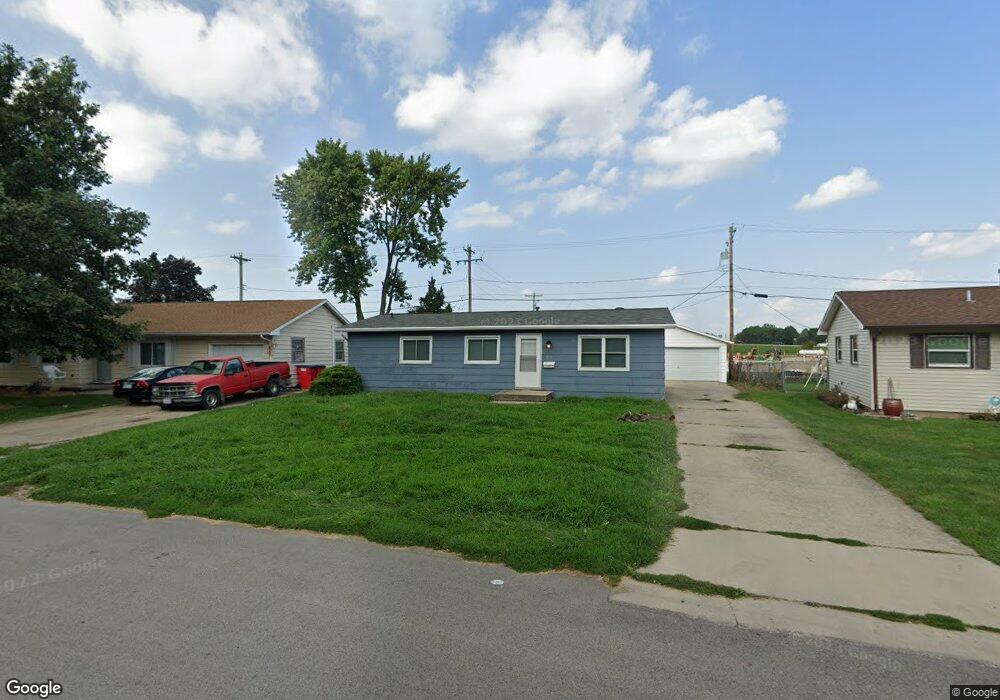
210 Briar Ln Champaign, IL 61820
Garden Park NeighborhoodEstimated Value: $107,000 - $149,000
Studio
2
Baths
1,008
Sq Ft
$119/Sq Ft
Est. Value
About This Home
This home is located at 210 Briar Ln, Champaign, IL 61820 and is currently estimated at $120,189, approximately $119 per square foot. 210 Briar Ln is a home located in Champaign County with nearby schools including Central High School and Franklin STEAM Academy.
Ownership History
Date
Name
Owned For
Owner Type
Purchase Details
Closed on
Mar 7, 2014
Sold by
First Bank & Trust Sb
Bought by
Neves Group Investments Llc
Current Estimated Value
Home Financials for this Owner
Home Financials are based on the most recent Mortgage that was taken out on this home.
Original Mortgage
$345,000
Interest Rate
4.35%
Mortgage Type
Future Advance Clause Open End Mortgage
Purchase Details
Closed on
Nov 15, 2013
Sold by
Harvey Bryant H and Harvey Bryant
Bought by
First Bank Of Savoy
Purchase Details
Closed on
May 7, 2010
Sold by
Kinney Smith Pulchratia and Kinney Pulchratia
Bought by
Neely Antwuan
Home Financials for this Owner
Home Financials are based on the most recent Mortgage that was taken out on this home.
Original Mortgage
$56,000
Interest Rate
4.86%
Mortgage Type
Future Advance Clause Open End Mortgage
Purchase Details
Closed on
Feb 18, 2003
Sold by
Kinney Curtis A
Bought by
Kinney Pulchratia
Create a Home Valuation Report for This Property
The Home Valuation Report is an in-depth analysis detailing your home's value as well as a comparison with similar homes in the area
Home Values in the Area
Average Home Value in this Area
Purchase History
| Date | Buyer | Sale Price | Title Company |
|---|---|---|---|
| Neves Group Investments Llc | $335,000 | None Available | |
| First Bank Of Savoy | -- | None Available | |
| Neely Antwuan | $56,000 | Allied | |
| Kinney Pulchratia | -- | -- |
Source: Public Records
Mortgage History
| Date | Status | Borrower | Loan Amount |
|---|---|---|---|
| Closed | Neves Group Investments Llc | $345,000 | |
| Previous Owner | Neely Antwuan | $56,000 |
Source: Public Records
Tax History
| Year | Tax Paid | Tax Assessment Tax Assessment Total Assessment is a certain percentage of the fair market value that is determined by local assessors to be the total taxable value of land and additions on the property. | Land | Improvement |
|---|---|---|---|---|
| 2024 | $684 | $14,910 | $5,840 | $9,070 |
| 2023 | $684 | $13,580 | $5,320 | $8,260 |
| 2022 | $601 | $12,530 | $4,910 | $7,620 |
| 2021 | $1,124 | $12,280 | $4,810 | $7,470 |
| 2020 | $604 | $12,590 | $4,930 | $7,660 |
| 2019 | $574 | $12,330 | $4,830 | $7,500 |
| 2018 | $1,092 | $12,130 | $4,750 | $7,380 |
| 2017 | $554 | $12,130 | $4,750 | $7,380 |
| 2016 | $486 | $11,880 | $4,650 | $7,230 |
| 2015 | $990 | $11,670 | $4,570 | $7,100 |
| 2014 | $477 | $11,670 | $4,570 | $7,100 |
| 2013 | $2,050 | $24,590 | $4,570 | $20,020 |
Source: Public Records
Map
Nearby Homes
- 1404 N Hickory St
- 412 Louisiana Ave
- LOT 202 of Atkins We Bloomington Rd
- 51 E Bradley Ave
- 36 E Beardsley Ave
- 38 E Beardsley Ave
- 56 E Beardsley Ave
- 111 Petry Ct
- 705 N Elm St
- 1009 N Prospect Ave
- 811 W Harvard St
- 11 E Columbia Ave
- 410 N State St Unit 4
- 408 N State St Unit 12
- 1507 N Mckinley Ave
- 307 N Prairie St Unit 9
- 301 N Neil St Unit 808-809
- 1604 Kirk Ln
- 107 N Elm St Unit 108
- 1811 Melanie Ln
Your Personal Tour Guide
Ask me questions while you tour the home.