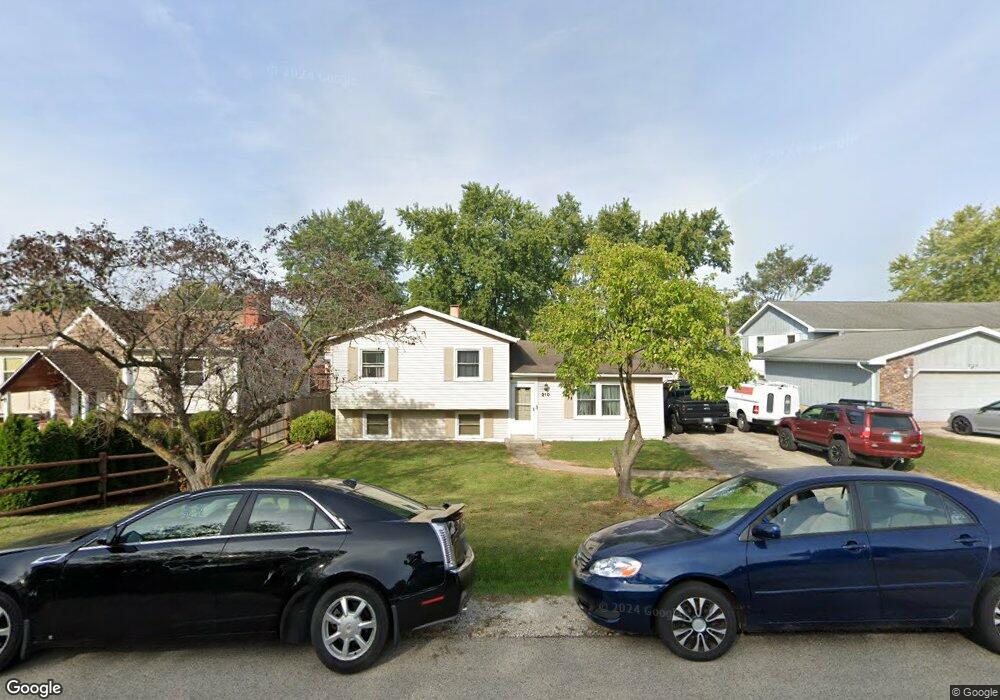
210 Briar Ln Lindenhurst, IL 60046
Estimated Value: $268,000 - $305,142
3
Beds
2
Baths
1,092
Sq Ft
$266/Sq Ft
Est. Value
About This Home
This home is located at 210 Briar Ln, Lindenhurst, IL 60046 and is currently estimated at $290,786, approximately $266 per square foot. 210 Briar Ln is a home located in Lake County with nearby schools including B.J. Hooper Elementary School, Palombi Middle School, and Lakes Community High School.
Ownership History
Date
Name
Owned For
Owner Type
Purchase Details
Closed on
Jan 24, 1997
Sold by
Suros Jose M and Suros Maria E
Bought by
Kreulach Paul E and Kreulach Tanya
Current Estimated Value
Home Financials for this Owner
Home Financials are based on the most recent Mortgage that was taken out on this home.
Original Mortgage
$91,600
Interest Rate
7.36%
Purchase Details
Closed on
Jul 26, 1994
Sold by
Poplawski Stephen and Poplawski Kristyn
Bought by
Suros Jose M and Suros Maria E
Home Financials for this Owner
Home Financials are based on the most recent Mortgage that was taken out on this home.
Original Mortgage
$114,300
Interest Rate
7.75%
Create a Home Valuation Report for This Property
The Home Valuation Report is an in-depth analysis detailing your home's value as well as a comparison with similar homes in the area
Home Values in the Area
Average Home Value in this Area
Purchase History
| Date | Buyer | Sale Price | Title Company |
|---|---|---|---|
| Kreulach Paul E | $114,500 | Chicago Title Insurance Co | |
| Suros Jose M | $127,000 | Blackhawk Title Services Inc |
Source: Public Records
Mortgage History
| Date | Status | Borrower | Loan Amount |
|---|---|---|---|
| Previous Owner | Kreulach Paul E | $91,600 | |
| Previous Owner | Suros Jose M | $114,300 |
Source: Public Records
Tax History Compared to Growth
Tax History
| Year | Tax Paid | Tax Assessment Tax Assessment Total Assessment is a certain percentage of the fair market value that is determined by local assessors to be the total taxable value of land and additions on the property. | Land | Improvement |
|---|---|---|---|---|
| 2024 | $7,455 | $81,060 | $12,503 | $68,557 |
| 2023 | $6,978 | $71,620 | $11,047 | $60,573 |
| 2022 | $6,978 | $65,037 | $9,891 | $55,146 |
| 2021 | $6,661 | $60,415 | $9,188 | $51,227 |
| 2020 | $6,532 | $58,480 | $8,894 | $49,586 |
| 2019 | $7,060 | $56,204 | $8,548 | $47,656 |
| 2018 | $6,519 | $54,445 | $12,067 | $42,378 |
| 2017 | $6,317 | $52,993 | $11,745 | $41,248 |
| 2016 | $6,412 | $50,847 | $11,269 | $39,578 |
| 2015 | $6,210 | $47,490 | $10,525 | $36,965 |
| 2014 | $6,067 | $46,794 | $10,574 | $36,220 |
| 2012 | $5,587 | $50,770 | $11,647 | $39,123 |
Source: Public Records
Map
Nearby Homes
- 200 S Beck Rd Unit 12
- 2424 E Thornwood Dr
- 2002 Burr Oak Ln
- 62 Ridge Ct
- 2105 Sprucewood Ln
- 1900 Burr Oak Ln Unit 15
- 102 Hawthorne Dr
- 710 Greenbriar Ln
- 77 Bridlepath Dr
- 37206 N Capillo Ave
- 2792 Spring Cir S
- 3707 Neubauer Cir
- 2798 Spring Cir S
- 419 Northgate Rd Unit 27
- 2200 Neubauer Cir Unit 131
- 4103 Neubauer Cir Unit 402
- 2813 Spring Cir S
- 418 Surrey Ln
- 1505 Neubauer Cir
- 37113 N Loretto Ave