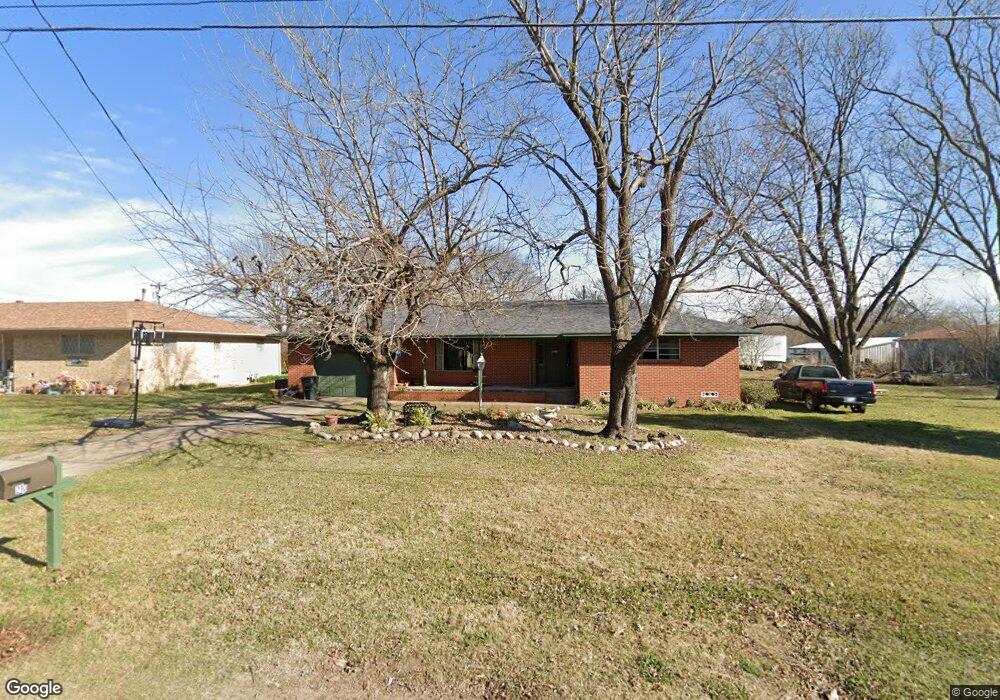
210 Burney St Colbert, OK 74733
Estimated Value: $163,000 - $191,000
3
Beds
2
Baths
1,605
Sq Ft
$114/Sq Ft
Est. Value
About This Home
This home is located at 210 Burney St, Colbert, OK 74733 and is currently estimated at $182,959, approximately $113 per square foot. 210 Burney St is a home with nearby schools including Ward Elementary School West and Colbert High School.
Ownership History
Date
Name
Owned For
Owner Type
Purchase Details
Closed on
Oct 28, 2016
Sold by
Mattingly Christine O and Burpo David Lee
Bought by
Mattingly Krista and Mattingly Christine
Current Estimated Value
Home Financials for this Owner
Home Financials are based on the most recent Mortgage that was taken out on this home.
Original Mortgage
$64,000
Outstanding Balance
$51,373
Interest Rate
3.5%
Mortgage Type
New Conventional
Estimated Equity
$131,586
Purchase Details
Closed on
Dec 18, 2007
Sold by
Hollowell Billie J and Seaman Janet M
Bought by
Mattingly Christine O
Home Financials for this Owner
Home Financials are based on the most recent Mortgage that was taken out on this home.
Original Mortgage
$55,000
Interest Rate
6.3%
Mortgage Type
Purchase Money Mortgage
Purchase Details
Closed on
Oct 7, 1996
Sold by
Chandler Ada and Chandler Judith
Bought by
Hollowell Billie Joe
Purchase Details
Closed on
Dec 21, 1994
Sold by
Hestily Helen and Hestily Womack T
Bought by
Chandler Ada and Chandler Judith
Create a Home Valuation Report for This Property
The Home Valuation Report is an in-depth analysis detailing your home's value as well as a comparison with similar homes in the area
Home Values in the Area
Average Home Value in this Area
Purchase History
| Date | Buyer | Sale Price | Title Company |
|---|---|---|---|
| Mattingly Krista | -- | None Available | |
| Mattingly Christine O | -- | None Available | |
| Hollowell Billie Joe | $55,000 | -- | |
| Chandler Ada | -- | -- |
Source: Public Records
Mortgage History
| Date | Status | Borrower | Loan Amount |
|---|---|---|---|
| Open | Mattingly Krista | $64,000 | |
| Closed | Mattingly Christine O | $55,000 |
Source: Public Records
Tax History Compared to Growth
Tax History
| Year | Tax Paid | Tax Assessment Tax Assessment Total Assessment is a certain percentage of the fair market value that is determined by local assessors to be the total taxable value of land and additions on the property. | Land | Improvement |
|---|---|---|---|---|
| 2025 | $843 | $10,692 | $1,650 | $9,042 |
| 2024 | $803 | $10,183 | $1,650 | $8,533 |
| 2023 | $803 | $9,698 | $1,650 | $8,048 |
| 2022 | $719 | $9,236 | $1,650 | $7,586 |
| 2021 | $722 | $9,236 | $1,650 | $7,586 |
| 2020 | $726 | $9,236 | $1,650 | $7,586 |
| 2019 | $710 | $8,988 | $1,650 | $7,338 |
| 2018 | $698 | $8,561 | $1,650 | $6,911 |
| 2017 | $668 | $8,153 | $1,650 | $6,503 |
| 2016 | $678 | $8,229 | $1,650 | $6,579 |
| 2015 | $682 | $8,229 | $1,650 | $6,579 |
| 2014 | $700 | $7,883 | $1,430 | $6,453 |
Source: Public Records
Map
Nearby Homes
- 210 N Collins St
- Tbd Private Rd
- 701 Pemberly
- 713 Pemberly
- 712 Pemberly
- 707 Pemberly
- 108 S Collins St
- 312 Godfrey Ave
- 215 E Leecraft Ave
- 515 Mccarley St
- 210 Umsted St
- 707 Mitchell Ave
- 713 Mitchell Ave
- 719 Mitchell Ave
- 627 S Franklin St
- 236 Floyd Everett Ln
- 6915 Sims Rd
- 4 N3640 Rd
- 444 Bohannon Rd
- 273 Ridgecrest Rd
- 214 Burney St
- 110 W Coleman
- 215 Burney St
- 207 Burney St
- 219 N Franklin St
- 203 Burney St
- 303 Burney St
- 206 Mccarley St
- 206 N Maupin Rd
- 305 Burney St
- 316 N Franklin St
- 210 Mccarley St
- 202 N Franklin St
- 216 N Franklin St
- 311 Burney St
- 306 N Maupin Rd
- 217 N Maupin Rd
- 312 Wells Rd
- 317 Burney St
- 302 W Coleman