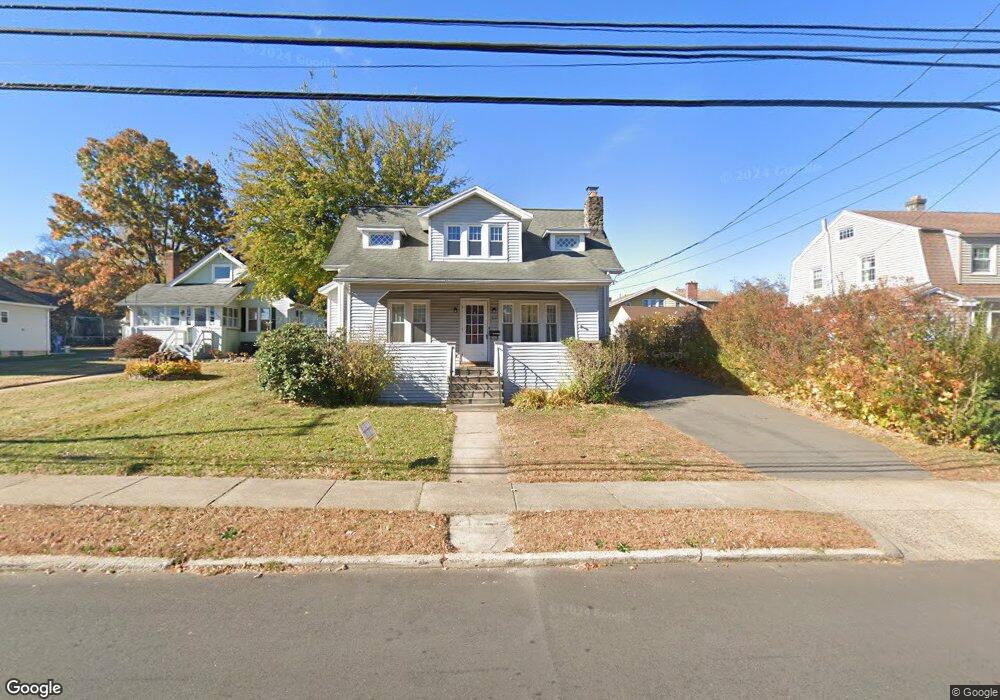
210 Carlton St New Britain, CT 06053
Estimated Value: $218,000 - $285,000
4
Beds
3
Baths
1,362
Sq Ft
$189/Sq Ft
Est. Value
About This Home
This home is located at 210 Carlton St, New Britain, CT 06053 and is currently estimated at $257,999, approximately $189 per square foot. 210 Carlton St is a home located in Hartford County with nearby schools including Holmes School, Pulaski Middle School, and Mountain Laurel Sudbury School.
Ownership History
Date
Name
Owned For
Owner Type
Purchase Details
Closed on
Oct 29, 2024
Sold by
Miele Domenico
Bought by
Central Prop Assoc Llc
Current Estimated Value
Purchase Details
Closed on
Jul 12, 2023
Sold by
Flynn Christopher G
Bought by
Miele Domenico
Purchase Details
Closed on
May 14, 2001
Sold by
Mascolo Filomena and Mascolo Caterina
Bought by
Flynn Christopher G
Home Financials for this Owner
Home Financials are based on the most recent Mortgage that was taken out on this home.
Original Mortgage
$60,000
Interest Rate
6.88%
Mortgage Type
Purchase Money Mortgage
Purchase Details
Closed on
Apr 13, 1992
Sold by
Zajac David D and Zajac Joann C
Bought by
Mascolo Filomena and Mascolo Caterina
Home Financials for this Owner
Home Financials are based on the most recent Mortgage that was taken out on this home.
Original Mortgage
$111,585
Interest Rate
8.73%
Mortgage Type
Purchase Money Mortgage
Create a Home Valuation Report for This Property
The Home Valuation Report is an in-depth analysis detailing your home's value as well as a comparison with similar homes in the area
Home Values in the Area
Average Home Value in this Area
Purchase History
| Date | Buyer | Sale Price | Title Company |
|---|---|---|---|
| Central Prop Assoc Llc | $210,000 | None Available | |
| Miele Domenico | $184,000 | None Available | |
| Flynn Christopher G | $126,500 | -- | |
| Mascolo Filomena | $112,000 | -- |
Source: Public Records
Mortgage History
| Date | Status | Borrower | Loan Amount |
|---|---|---|---|
| Previous Owner | Mascolo Filomena | $60,000 | |
| Previous Owner | Mascolo Filomena | $111,585 | |
| Previous Owner | Mascolo Filomena | $6,150 |
Source: Public Records
Tax History Compared to Growth
Tax History
| Year | Tax Paid | Tax Assessment Tax Assessment Total Assessment is a certain percentage of the fair market value that is determined by local assessors to be the total taxable value of land and additions on the property. | Land | Improvement |
|---|---|---|---|---|
| 2025 | $5,880 | $150,080 | $56,420 | $93,660 |
| 2024 | $5,942 | $150,080 | $56,420 | $93,660 |
| 2023 | $5,745 | $150,080 | $56,420 | $93,660 |
| 2022 | $4,813 | $97,230 | $25,970 | $71,260 |
| 2021 | $4,813 | $97,230 | $25,970 | $71,260 |
| 2020 | $4,910 | $97,230 | $25,970 | $71,260 |
| 2019 | $4,910 | $97,230 | $25,970 | $71,260 |
| 2018 | $4,910 | $97,230 | $25,970 | $71,260 |
| 2017 | $4,387 | $86,870 | $23,730 | $63,140 |
| 2016 | $4,387 | $86,870 | $23,730 | $63,140 |
| 2015 | $4,257 | $86,870 | $23,730 | $63,140 |
| 2014 | $4,257 | $86,870 | $23,730 | $63,140 |
Source: Public Records
Map
Nearby Homes
- 335 Commonwealth Ave
- 53 Park Dr
- 34 Oneida St
- 91 Brighton St
- 51 Tunxis St
- 258 Eddy Glover Blvd
- 16 Vincent Ave
- 426 Allen St
- 1403 Stanley St
- 394 Mcclintock St
- 108 Commonwealth Ave
- 154 Allen St
- 262 Tremont St
- 220 Lasalle St Unit B4
- 227 Amherst St
- 107 Allen St
- 31 Acorn St
- 34 Beacon St
- 104 Daly Ave
- 83 Kim Dr
- 206 Carlton St
- 218 Carlton St
- 385 Commonwealth Ave
- 200 Carlton St
- 381 Commonwealth Ave
- 194 Carlton St
- 217 Carlton St
- 375 Commonwealth Ave
- 203 Carlton St
- 188 Carlton St
- 201 Francis St
- 227 Francis St
- 398 Commonwealth Ave
- 367 Commonwealth Ave
- 367 Commonwealth Ave Unit Right Side
- 367 Commonwealth Ave Unit Right unit
- 367 Commonwealth Ave Unit Left Unit
- 367 Commonwealth Ave Unit Left
- 421 Commonwealth Ave