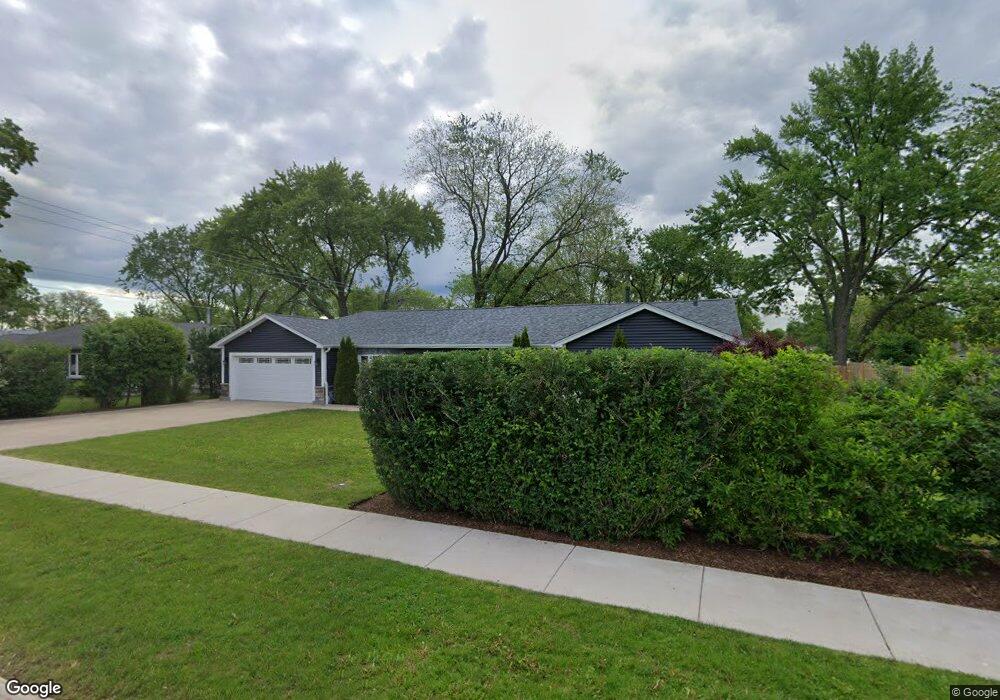
210 Carthage Ln Hoffman Estates, IL 60169
East Schaumburg NeighborhoodEstimated Value: $357,383 - $408,000
4
Beds
3
Baths
1,401
Sq Ft
$266/Sq Ft
Est. Value
About This Home
This home is located at 210 Carthage Ln, Hoffman Estates, IL 60169 and is currently estimated at $372,096, approximately $265 per square foot. 210 Carthage Ln is a home located in Cook County with nearby schools including Fairview Elementary School, Helen Keller Junior High School, and J B Conant High School.
Ownership History
Date
Name
Owned For
Owner Type
Purchase Details
Closed on
May 29, 2021
Sold by
Egan Mark J and Egan Jean E
Bought by
Patel Dilipkumar B and Patel Pooja D
Current Estimated Value
Home Financials for this Owner
Home Financials are based on the most recent Mortgage that was taken out on this home.
Original Mortgage
$254,400
Outstanding Balance
$188,026
Interest Rate
2.9%
Mortgage Type
New Conventional
Estimated Equity
$184,070
Purchase Details
Closed on
Jun 8, 2015
Sold by
Shea Pamela G O and Gros Jeraldine H
Bought by
Egan Mark J and Egan Jean F
Home Financials for this Owner
Home Financials are based on the most recent Mortgage that was taken out on this home.
Original Mortgage
$122,400
Interest Rate
4.5%
Mortgage Type
New Conventional
Purchase Details
Closed on
Dec 8, 2010
Sold by
Hannula Roy M and Hannula Idele M
Bought by
Hannula Roy M and Hannula Idele M
Create a Home Valuation Report for This Property
The Home Valuation Report is an in-depth analysis detailing your home's value as well as a comparison with similar homes in the area
Home Values in the Area
Average Home Value in this Area
Purchase History
| Date | Buyer | Sale Price | Title Company |
|---|---|---|---|
| Patel Dilipkumar B | $318,000 | Precision Title | |
| Egan Mark J | $153,000 | Attorneys Title Guaranty Fun | |
| Hannula Roy M | -- | None Available |
Source: Public Records
Mortgage History
| Date | Status | Borrower | Loan Amount |
|---|---|---|---|
| Open | Patel Dilipkumar B | $254,400 | |
| Previous Owner | Egan Mark J | $122,400 |
Source: Public Records
Tax History
| Year | Tax Paid | Tax Assessment Tax Assessment Total Assessment is a certain percentage of the fair market value that is determined by local assessors to be the total taxable value of land and additions on the property. | Land | Improvement |
|---|---|---|---|---|
| 2025 | $6,234 | $30,000 | $7,315 | $22,685 |
| 2024 | $6,234 | $23,628 | $6,270 | $17,358 |
| 2023 | $6,576 | $25,563 | $6,270 | $19,293 |
| 2022 | $6,576 | $25,563 | $6,270 | $19,293 |
| 2021 | $5,933 | $21,040 | $4,441 | $16,599 |
| 2020 | $5,869 | $21,040 | $4,441 | $16,599 |
| 2019 | $5,917 | $23,641 | $4,441 | $19,200 |
| 2018 | $5,052 | $18,928 | $3,918 | $15,010 |
| 2017 | $4,981 | $18,928 | $3,918 | $15,010 |
| 2016 | $4,895 | $18,928 | $3,918 | $15,010 |
| 2015 | $4,982 | $18,134 | $3,396 | $14,738 |
| 2014 | $1,393 | $18,134 | $3,396 | $14,738 |
| 2013 | -- | $18,134 | $3,396 | $14,738 |
Source: Public Records
Map
Nearby Homes
- 829 Linden Cir
- 1075 Apricot St
- 410 Aster Ln
- 200 W Thacker St
- 640 Sturnbridge Ln
- 367 Juniper Tree Ct Unit 3
- 755 Whalom Ln Unit 2C2
- 988 Butter Creek Ct Unit 4ND
- 601 Fairbanks Ct Unit V2
- 313 Lincoln St
- 368 Willow Tree Ct
- 718 Sturnbridge Ln
- 260 Mohave St
- 480 Illinois Blvd
- 945 Morton St
- 345 Maricopa Ln
- 625 Morton St
- 236 N Waterford Dr Unit 11B
- 829 Heatherstone Dr
- 631 Schooner Point Unit 106B
- 220 Arizona Blvd
- 204 Carthage Ln
- 195 Carthage Ln
- 257 E Berkley Ln
- 200 Carthage Ln
- 195 Chandler Ln
- 253 E Berkley Ln
- 215 Arizona Blvd
- 189 Carthage Ln
- 249 E Berkley Ln
- 180 Arizona Blvd
- 190 Chandler Ln
- 240 Bradley Ln
- 194 Carthage Ln
- 243 E Berkley Ln
- 185 Chandler Ln
- 160 Arizona Blvd
- 175 Arizona Blvd
- 230 Bradley Ln
- 239 E Berkley Ln
Your Personal Tour Guide
Ask me questions while you tour the home.