210 Chapman Ct La Fayette, GA 30728
Estimated Value: $186,873 - $543,000
--
Bed
1
Bath
1,728
Sq Ft
$220/Sq Ft
Est. Value
About This Home
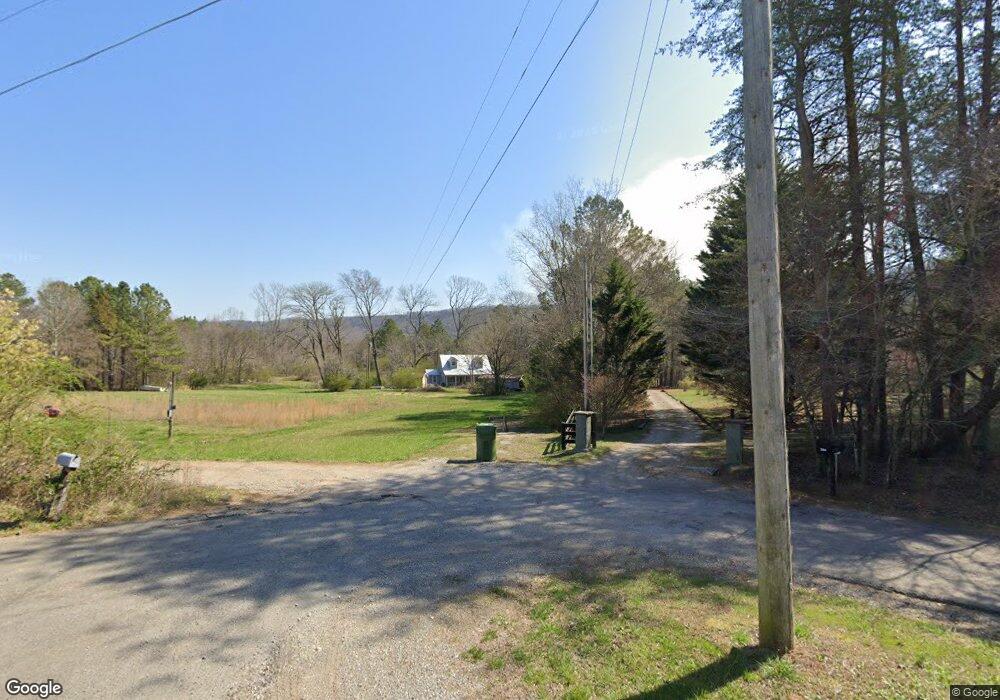
This home is located at 210 Chapman Ct, La Fayette, GA 30728 and is currently estimated at $380,218, approximately $220 per square foot. 210 Chapman Ct is a home located in Walker County with nearby schools including Rock Spring Elementary School and Lafayette High School.
Ownership History
Date
Name
Owned For
Owner Type
Purchase Details
Closed on
Aug 27, 1999
Sold by
Hicks Troy G
Bought by
Hicks Robert L and Hicks Leota
Current Estimated Value
Purchase Details
Closed on
Aug 15, 1975
Sold by
Potts Potts W and Potts
Bought by
Hicks Troy G
Purchase Details
Closed on
Dec 11, 1974
Bought by
Potts Potts W and Potts
Create a Home Valuation Report for This Property
The Home Valuation Report is an in-depth analysis detailing your home's value as well as a comparison with similar homes in the area
Home Values in the Area
Average Home Value in this Area
Purchase History
| Date | Buyer | Sale Price | Title Company |
|---|---|---|---|
| Hicks Robert L | -- | -- | |
| Hicks Troy G | -- | -- | |
| Potts Potts W | -- | -- |
Source: Public Records
Tax History Compared to Growth
Tax History
| Year | Tax Paid | Tax Assessment Tax Assessment Total Assessment is a certain percentage of the fair market value that is determined by local assessors to be the total taxable value of land and additions on the property. | Land | Improvement |
|---|---|---|---|---|
| 2024 | $265 | $49,810 | $17,662 | $32,148 |
| 2023 | $262 | $44,470 | $14,018 | $30,452 |
| 2022 | $1,935 | $75,857 | $19,717 | $56,140 |
| 2021 | $1,864 | $65,765 | $19,717 | $46,048 |
| 2020 | $216 | $55,489 | $19,703 | $35,786 |
| 2019 | $218 | $55,489 | $19,703 | $35,786 |
| 2018 | $1,468 | $55,489 | $19,703 | $35,786 |
| 2017 | $412 | $55,489 | $19,703 | $35,786 |
| 2016 | $167 | $55,489 | $19,703 | $35,786 |
| 2015 | $188 | $51,254 | $17,912 | $33,342 |
| 2014 | $117 | $51,254 | $17,912 | $33,342 |
| 2013 | -- | $51,253 | $17,912 | $33,341 |
Source: Public Records
Map
Nearby Homes
- 1052 Huffman Rd
- 0 Alabama Hwy Unit TRACT 3 10244950
- 0 Alabama Hwy Unit 1520958
- 0 Alabama Hwy Unit 21222630
- Old Alabama Hwy Ga-151
- 201 Van Dell Dr
- 200 Cattail Dr
- 1314 Mcintire Rd
- 182 Boxer Ln
- 0 Georgia 95
- 72 Brutis Dr
- 533 Van Dell Dr
- 15 Brutis Dr
- 106 Meadow Oak Dr
- 58 Oak Run
- 7606 Highway 95
- 23 Oak Meadow Dr
- 5062 Georgia 95
- 6280 Georgia 151
- 0 Temperance Hall Rd Unit 10506446
- 210 Chapman Ct
- 194 Chapman Ct
- 252 Chapman Ct
- 110 Chapman Ct
- 254 Chapman Ct
- 129 Chapman Ct
- 375 Hollyhock Ln
- 430 Hollyhock Ln
- 294 Chapman Rd
- 256 Chapman Rd
- 318 Chapman Rd
- 35 Chapman Ct
- 184 Chapman Rd
- 184 Chapman Rd
- 351 Chapman Rd
- 281 Chapman Rd
- 872 Highway 151
- 279 Chapman Rd
- 279 Chapman Ct
- 568 Highway 151