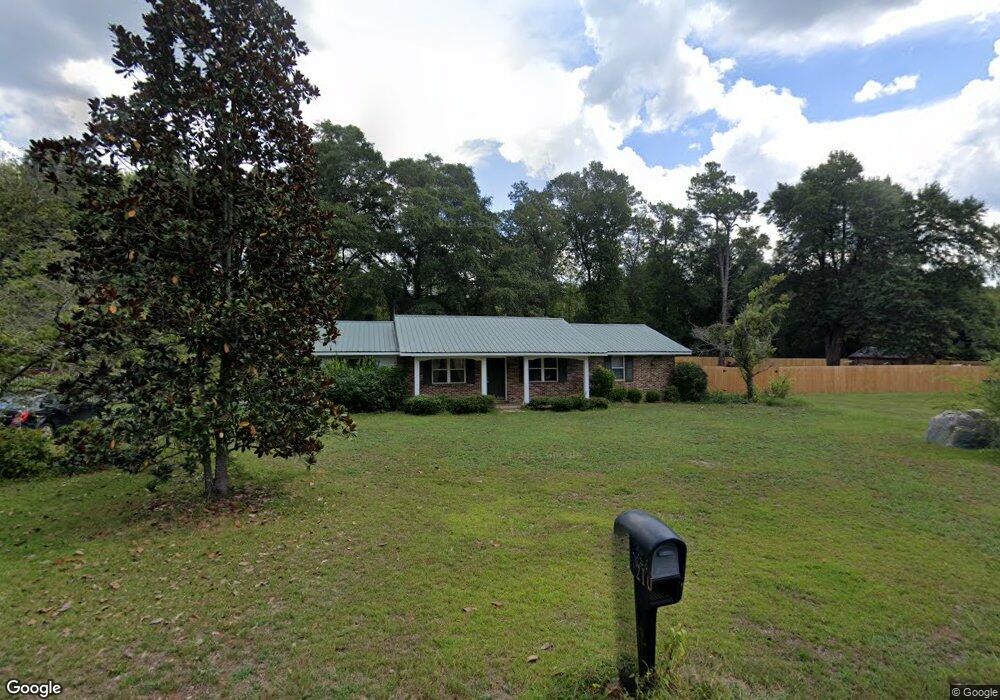
210 Chris Cir Keysville, GA 30816
Estimated Value: $149,846 - $203,000
3
Beds
2
Baths
1,175
Sq Ft
$148/Sq Ft
Est. Value
About This Home
This home is located at 210 Chris Cir, Keysville, GA 30816 and is currently estimated at $173,962, approximately $148 per square foot. 210 Chris Cir is a home located in Burke County with nearby schools including Burke County High School.
Ownership History
Date
Name
Owned For
Owner Type
Purchase Details
Closed on
Feb 20, 2018
Sold by
Ford John
Bought by
Ford Nathan M and Ford Sarah D
Current Estimated Value
Home Financials for this Owner
Home Financials are based on the most recent Mortgage that was taken out on this home.
Original Mortgage
$82,326
Outstanding Balance
$65,513
Interest Rate
4.15%
Mortgage Type
New Conventional
Estimated Equity
$108,449
Purchase Details
Closed on
Jul 6, 2016
Sold by
The Bank Of New York Mello
Bought by
Ford John
Purchase Details
Closed on
Nov 3, 2015
Sold by
Jenkins Charles C
Bought by
The Bank Of New York Mellon
Purchase Details
Closed on
Apr 23, 2004
Sold by
Shaw Jerry Lavern
Bought by
Jenkins Charles C
Purchase Details
Closed on
Aug 29, 2003
Sold by
Shaw Lillian R
Bought by
Jenkins Charles C
Purchase Details
Closed on
Mar 8, 2002
Sold by
Shaw Lillian R
Bought by
Shaw Lillian R
Create a Home Valuation Report for This Property
The Home Valuation Report is an in-depth analysis detailing your home's value as well as a comparison with similar homes in the area
Home Values in the Area
Average Home Value in this Area
Purchase History
| Date | Buyer | Sale Price | Title Company |
|---|---|---|---|
| Ford Nathan M | $80,000 | -- | |
| Ford John | $38,500 | -- | |
| The Bank Of New York Mellon | $63,152 | -- | |
| Jenkins Charles C | -- | -- | |
| Jenkins Charles C | -- | -- | |
| Jenkins Charles C | -- | -- | |
| Jenkins Charles C | $79,500 | -- | |
| Shaw Lillian R | -- | -- |
Source: Public Records
Mortgage History
| Date | Status | Borrower | Loan Amount |
|---|---|---|---|
| Open | Ford Nathan M | $82,326 |
Source: Public Records
Tax History Compared to Growth
Tax History
| Year | Tax Paid | Tax Assessment Tax Assessment Total Assessment is a certain percentage of the fair market value that is determined by local assessors to be the total taxable value of land and additions on the property. | Land | Improvement |
|---|---|---|---|---|
| 2024 | $1,114 | $57,102 | $1,584 | $55,518 |
| 2023 | $1,221 | $57,150 | $2,112 | $55,038 |
| 2022 | $1,033 | $48,350 | $2,112 | $46,238 |
| 2021 | $900 | $41,112 | $2,112 | $39,000 |
| 2020 | $901 | $41,112 | $2,112 | $39,000 |
| 2019 | $842 | $37,747 | $2,112 | $35,635 |
| 2018 | $842 | $37,747 | $2,112 | $35,635 |
| 2017 | $345 | $35,478 | $2,112 | $33,366 |
| 2016 | $799 | $35,478 | $2,112 | $33,366 |
| 2015 | $745 | $34,823 | $2,112 | $32,711 |
| 2014 | $751 | $34,823 | $2,112 | $32,711 |
| 2013 | -- | $34,823 | $2,112 | $32,711 |
Source: Public Records
Map
Nearby Homes
- 0 Story Mill Rd Unit 539969
- 5492 Story Mill Rd
- 0 Spread Oak Rd Unit 538280
- Tbd Spread Oak Rd
- Tbd Spread Oak Rd
- 0 Hannah Ln
- Tbd Spread Oak Rd
- 270 Autumn Rd
- 0 W Quaker Rd Unit 10612044
- 0 W Quaker Rd Unit 24022395
- 0 W Quaker Rd Unit 542155
- 210 Deer Run Rd
- 6938 Story Mill Rd
- 153 Campbell Cir
- 1441 W Quaker Rd
- 506 Greiner Cir
- 0 Campbell Cir
- 122 Arrowhead Cir
- 805 Manderson Cir
- 102 Antlers Trail
- 210 Chris Cir
- 210 Chris Cir
- 220 Chris Cir
- 196 Chris Cir
- 197 Chris Cir
- 184 Chris Cir
- 180 Chris Cir
- 163 Chris Cir
- 163 Jerry Rd
- 144 Jerry Rd
- 166 Chris Cir
- 129 Jerry Rd
- 1472 George Perkins Rd
- 133 Chris Cir
- 145 Chris Cir
- 131 Jerry Rd
- 128 Jerry Rd
- 5336 Story Mill Rd
- 1486 George Perkins Rd
- 5342 Story Mill Rd