Estimated Value: $263,000 - $304,156
3
Beds
3
Baths
1,635
Sq Ft
$175/Sq Ft
Est. Value
About This Home
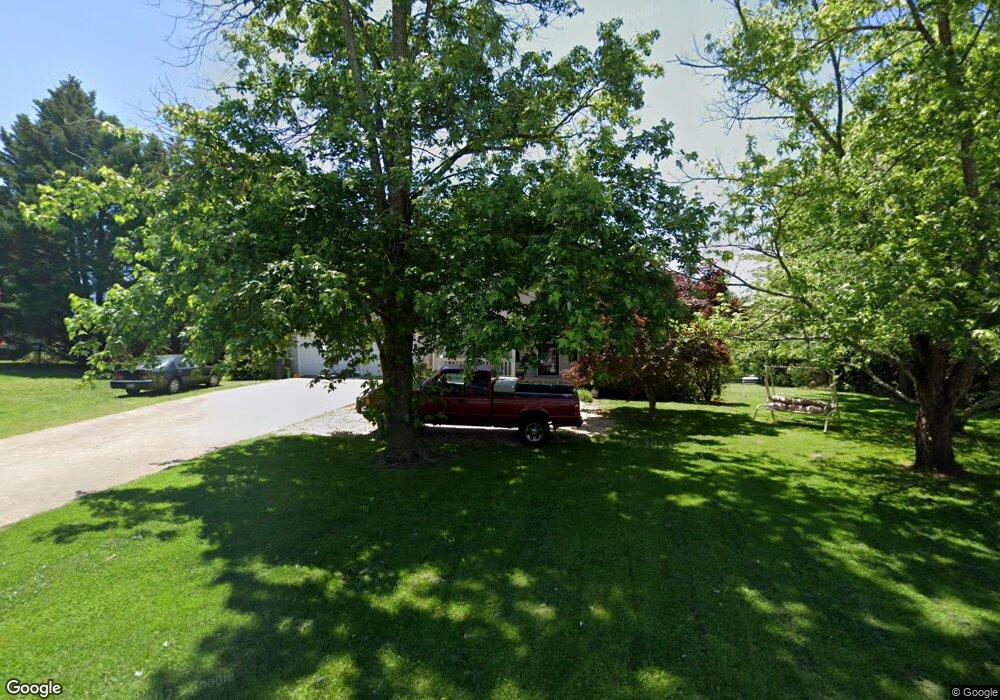
This home is located at 210 Cook St, Alto, GA 30510 and is currently estimated at $286,789, approximately $175 per square foot. 210 Cook St is a home located in Habersham County with nearby schools including Baldwin Elementary School, South Habersham Middle School, and Habersham Success Academy.
Ownership History
Date
Name
Owned For
Owner Type
Purchase Details
Closed on
May 4, 2020
Sold by
Lipchinsky Max M
Bought by
Brooksher Adrian Eugene
Current Estimated Value
Home Financials for this Owner
Home Financials are based on the most recent Mortgage that was taken out on this home.
Original Mortgage
$171,830
Outstanding Balance
$153,526
Interest Rate
3.75%
Mortgage Type
FHA
Estimated Equity
$133,263
Purchase Details
Closed on
Jul 6, 2010
Sold by
Rogers Penny
Bought by
Hsbc Mtg Svcs Inc
Purchase Details
Closed on
Aug 17, 2005
Sold by
Arrowood Timothy Earl
Bought by
Rogers Penny
Home Financials for this Owner
Home Financials are based on the most recent Mortgage that was taken out on this home.
Original Mortgage
$135,000
Interest Rate
8.25%
Mortgage Type
New Conventional
Create a Home Valuation Report for This Property
The Home Valuation Report is an in-depth analysis detailing your home's value as well as a comparison with similar homes in the area
Home Values in the Area
Average Home Value in this Area
Purchase History
| Date | Buyer | Sale Price | Title Company |
|---|---|---|---|
| Brooksher Adrian Eugene | $175,000 | -- | |
| Hsbc Mtg Svcs Inc | $91,484 | -- | |
| Rogers Penny | $135,000 | -- |
Source: Public Records
Mortgage History
| Date | Status | Borrower | Loan Amount |
|---|---|---|---|
| Open | Brooksher Adrian Eugene | $171,830 | |
| Previous Owner | Rogers Penny | $135,000 |
Source: Public Records
Tax History Compared to Growth
Tax History
| Year | Tax Paid | Tax Assessment Tax Assessment Total Assessment is a certain percentage of the fair market value that is determined by local assessors to be the total taxable value of land and additions on the property. | Land | Improvement |
|---|---|---|---|---|
| 2025 | $3,099 | $108,648 | $20,800 | $87,848 |
| 2024 | $3,272 | $126,060 | $20,800 | $105,260 |
| 2023 | $2,689 | $107,540 | $20,800 | $86,740 |
| 2022 | $2,208 | $84,688 | $13,000 | $71,688 |
| 2021 | $1,817 | $70,000 | $13,000 | $57,000 |
| 2020 | $1,528 | $56,816 | $10,400 | $46,416 |
| 2019 | $1,530 | $56,816 | $10,400 | $46,416 |
| 2018 | $1,448 | $54,216 | $7,800 | $46,416 |
| 2017 | $1,342 | $49,956 | $7,800 | $42,156 |
| 2016 | $1,303 | $124,890 | $7,800 | $42,156 |
| 2015 | $1,048 | $101,670 | $5,200 | $35,468 |
| 2014 | $998 | $95,000 | $9,880 | $28,120 |
| 2013 | -- | $38,000 | $9,880 | $28,120 |
Source: Public Records
Map
Nearby Homes
- 130 E Railroad Ave
- 135 Oak Terrace Dr
- 117 Oak Terrace Dr
- 3073 Gainesville Hwy
- 603 Nix Rd
- 933 Alto Mud Creek Rd
- 3568 State Route 365
- 2484 Apple Pie Ridge Rd Unit 11 ACRES
- 1085 Smokey Rd
- 2154 Apple Pie Ridge Rd
- 738 Wilbanks Rd
- 140 Highland Pointe Dr
- 2000 Alto Mud Creek Rd
- 0 State Route 365 Unit 10496178
- 0 State Route 365 Unit 10496183
- 752 Dawn Place
- 324 Highland Pointe Dr
- 39 Planters Creek Dr
- 41 Planters Creek Dr
- 179 Sunset Oaks Dr
- 214 Cook St
- 206 Cook St
- 213 Cook St
- 228 Wade St
- 270 Wade St
- 202 Cook St
- 220 Cook St
- 209 Cook St
- 209 Cook St Unit 11
- 217 Cook St
- 217 Cook St Unit 9
- 320 Wade St
- 0 Wade St Unit 7223622
- 0 Wade St Unit 3248859
- 0 Wade St Unit 8793592
- 0 Wade St Unit 8441349
- 0 Wade St Unit 7333824
- 0 Wade St
- 0 Cook St Unit 8068094
- 0 Cook St Unit 8714831