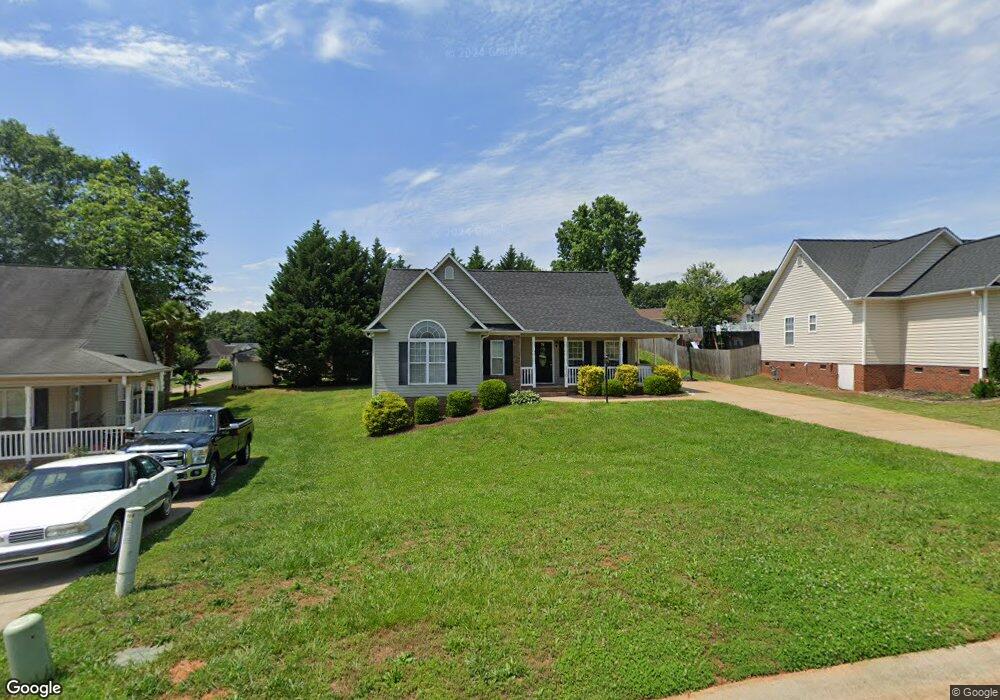
210 Cool Water Ct Boiling Springs, SC 29316
Estimated Value: $217,000 - $240,000
3
Beds
2
Baths
1,352
Sq Ft
$170/Sq Ft
Est. Value
About This Home
This home is located at 210 Cool Water Ct, Boiling Springs, SC 29316 and is currently estimated at $229,218, approximately $169 per square foot. 210 Cool Water Ct is a home located in Spartanburg County with nearby schools including Boiling Springs Middle School, Boiling Springs High School, and High Point Academy.
Ownership History
Date
Name
Owned For
Owner Type
Purchase Details
Closed on
Jun 14, 2022
Sold by
Jeffery Norwood
Bought by
Norwood Crystal L
Current Estimated Value
Purchase Details
Closed on
Mar 16, 2012
Sold by
Taylor Jared Glenn
Bought by
Norwood Crystal L and Norwood Jeffery
Home Financials for this Owner
Home Financials are based on the most recent Mortgage that was taken out on this home.
Original Mortgage
$114,285
Interest Rate
3.89%
Mortgage Type
Future Advance Clause Open End Mortgage
Purchase Details
Closed on
Aug 21, 2006
Sold by
Rucinski Charles J and Rucinski Margaret A
Bought by
Wells Fargo Bank Na
Purchase Details
Closed on
Apr 12, 2006
Sold by
Wells Fargo Bank Na
Bought by
Taylor Jared Glen
Home Financials for this Owner
Home Financials are based on the most recent Mortgage that was taken out on this home.
Original Mortgage
$90,000
Interest Rate
6.25%
Mortgage Type
New Conventional
Create a Home Valuation Report for This Property
The Home Valuation Report is an in-depth analysis detailing your home's value as well as a comparison with similar homes in the area
Home Values in the Area
Average Home Value in this Area
Purchase History
| Date | Buyer | Sale Price | Title Company |
|---|---|---|---|
| Norwood Crystal L | -- | Brothers Surveying Inc | |
| Norwood Crystal L | -- | Brothers Surveying Inc | |
| Norwood Crystal L | $112,000 | -- | |
| Wells Fargo Bank Na | $2,500 | None Available | |
| Taylor Jared Glen | $100,000 | None Available |
Source: Public Records
Mortgage History
| Date | Status | Borrower | Loan Amount |
|---|---|---|---|
| Previous Owner | Norwood Crystal L | $114,285 | |
| Previous Owner | Taylor Jared Glen | $90,000 |
Source: Public Records
Tax History Compared to Growth
Tax History
| Year | Tax Paid | Tax Assessment Tax Assessment Total Assessment is a certain percentage of the fair market value that is determined by local assessors to be the total taxable value of land and additions on the property. | Land | Improvement |
|---|---|---|---|---|
| 2025 | $3,294 | $8,840 | $1,528 | $7,312 |
| 2024 | $3,294 | $8,840 | $1,528 | $7,312 |
| 2023 | $3,294 | $8,840 | $1,528 | $7,312 |
| 2022 | $973 | $5,125 | $759 | $4,366 |
| 2021 | $973 | $5,125 | $759 | $4,366 |
| 2020 | $956 | $5,125 | $759 | $4,366 |
| 2019 | $956 | $5,125 | $759 | $4,366 |
| 2018 | $936 | $5,125 | $759 | $4,366 |
| 2017 | $828 | $4,456 | $800 | $3,656 |
| 2016 | $828 | $4,456 | $800 | $3,656 |
| 2015 | $817 | $4,456 | $800 | $3,656 |
| 2014 | $812 | $4,456 | $800 | $3,656 |
Source: Public Records
Map
Nearby Homes
- 725 Cotton Branch Dr
- 0 Woodshire Dr Unit 316794
- 108 Woodshire Dr
- 210 Oakmont Dr
- 156 Hunter Ridge Dr
- 921 E Emerald Springs Dr
- 2274 Hemming Way
- 2325 Caffry Ln
- 238 River Forest Dr
- 112 Wells Dr
- 522 Hemlock Dr
- 144 Hunter Ridge Dr
- 147 Hunter Ridge Dr
- 2031 Evergreen Dr
- Wisteria II Plan at Lynbrook
- Bradley II Plan at Lynbrook
- Devonshire ll Plan at Lynbrook
- Benton II Plan at Lynbrook
- 160 Hunter Ridge Dr
- 152 Hunter Ridge Dr
- 206 Cool Water Ct
- 214 Cool Water Ct
- 823 Creeks Edge Ct
- 202 Cool Water Ct
- 710 Running Creek Ln
- 218 Cool Water Ct
- 829 Creeks Edge Ct
- 817 Creeks Edge Ct
- 205 Cool Water Ct
- 531 Plantation Creek Dr
- 222 Cool Water Ct
- 826 Creeks Edge Ct
- 736 Running Creek Ln
- 811 Creeks Edge Ct
- 537 Plantation Creek Dr
- 231 Cool Water Ct
- 818 Creeks Edge Ct
- 226 Cool Water Ct
- 715 Running Creek Ln
- 709 Running Creek Ln