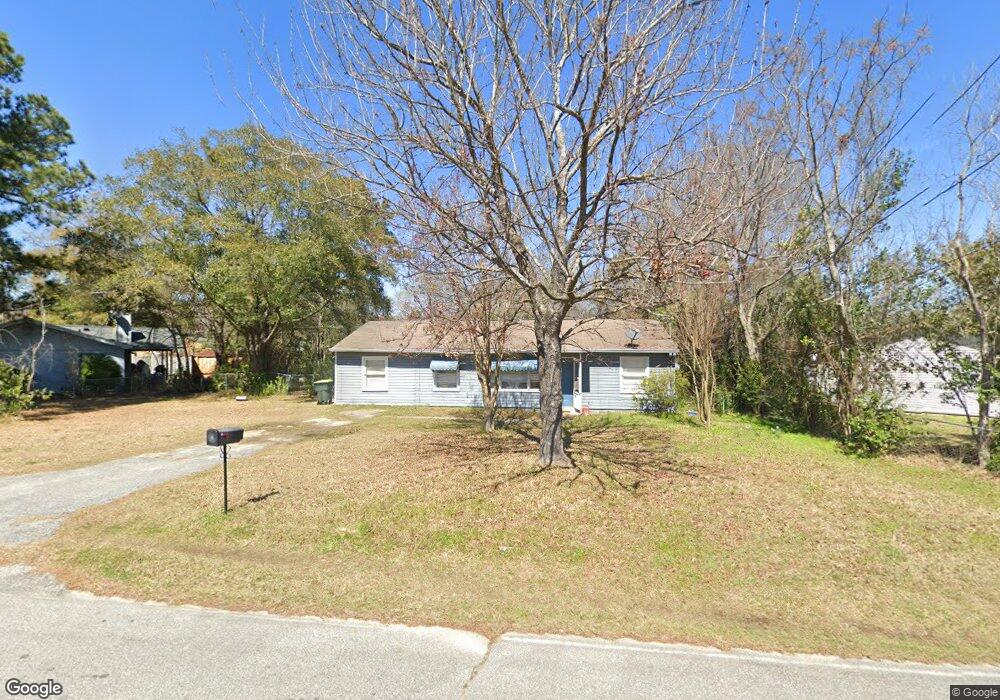
210 Cox Dr Warner Robins, GA 31093
Estimated Value: $59,000 - $125,962
Studio
--
Bath
1,323
Sq Ft
$76/Sq Ft
Est. Value
About This Home
This home is located at 210 Cox Dr, Warner Robins, GA 31093 and is currently estimated at $99,991, approximately $75 per square foot. 210 Cox Dr is a home located in Houston County with nearby schools including C. B. Watson Primary School, Northside Middle School, and Northside High School.
Ownership History
Date
Name
Owned For
Owner Type
Purchase Details
Closed on
Jul 26, 2006
Sold by
Hsbc Bank Usa Na
Bought by
Trojan Farms & Real Estates Llc
Current Estimated Value
Home Financials for this Owner
Home Financials are based on the most recent Mortgage that was taken out on this home.
Original Mortgage
$28,296
Interest Rate
6.6%
Mortgage Type
Purchase Money Mortgage
Purchase Details
Closed on
Jun 6, 2006
Sold by
White Ethelyn and White Harvey
Bought by
Hsbc Bank Usa Na
Home Financials for this Owner
Home Financials are based on the most recent Mortgage that was taken out on this home.
Original Mortgage
$28,296
Interest Rate
6.6%
Mortgage Type
Purchase Money Mortgage
Purchase Details
Closed on
Aug 13, 2003
Sold by
Prg Realty Llc
Bought by
White Harvey and White Cynthia
Purchase Details
Closed on
Feb 13, 2002
Sold by
City Of Warner Robins
Bought by
Prg Realty Llc
Purchase Details
Closed on
May 23, 2001
Bought by
City Of Warner Robins
Create a Home Valuation Report for This Property
The Home Valuation Report is an in-depth analysis detailing your home's value as well as a comparison with similar homes in the area
Home Values in the Area
Average Home Value in this Area
Purchase History
| Date | Buyer | Sale Price | Title Company |
|---|---|---|---|
| Trojan Farms & Real Estates Llc | $28,500 | None Available | |
| Hsbc Bank Usa Na | $45,012 | None Available | |
| White Harvey | $45,000 | -- | |
| Prg Realty Llc | -- | -- | |
| City Of Warner Robins | $26,800 | -- |
Source: Public Records
Mortgage History
| Date | Status | Borrower | Loan Amount |
|---|---|---|---|
| Closed | Trojan Farms & Real Estates Llc | $28,296 |
Source: Public Records
Tax History
| Year | Tax Paid | Tax Assessment Tax Assessment Total Assessment is a certain percentage of the fair market value that is determined by local assessors to be the total taxable value of land and additions on the property. | Land | Improvement |
|---|---|---|---|---|
| 2024 | $734 | $22,440 | $5,000 | $17,440 |
| 2023 | $557 | $16,880 | $2,680 | $14,200 |
| 2022 | $308 | $13,400 | $2,680 | $10,720 |
| 2021 | $272 | $11,760 | $2,680 | $9,080 |
| 2020 | $280 | $12,040 | $2,680 | $9,360 |
| 2019 | $280 | $12,040 | $2,680 | $9,360 |
| 2018 | $280 | $12,040 | $2,680 | $9,360 |
| 2017 | $280 | $12,040 | $2,680 | $9,360 |
| 2016 | $280 | $12,040 | $2,680 | $9,360 |
| 2015 | -- | $12,040 | $2,680 | $9,360 |
| 2014 | -- | $15,320 | $2,680 | $12,640 |
| 2013 | -- | $15,320 | $2,680 | $12,640 |
Source: Public Records
Map
Nearby Homes
- 108 Smith Place
- 220 Francis St
- 239 Ward St
- 300 Ward St
- 249 Ward St
- 714 Camellia Cir
- 202 Elmwood St
- 116 Tabor Dr
- 122 Tabor Dr
- 102 Camellia Cir
- 302 Dunmurry Place
- 102 Oregon Ct
- 100 Mauldon Ct
- 405 Dunmurry Place
- 100 Silas Ct
- 212 Dunmurry Place
- 215 Camellia Cir
- 437 Dunmurry Place
- 427 Alabama Ave
- 220 Wendan Way
Your Personal Tour Guide
Ask me questions while you tour the home.