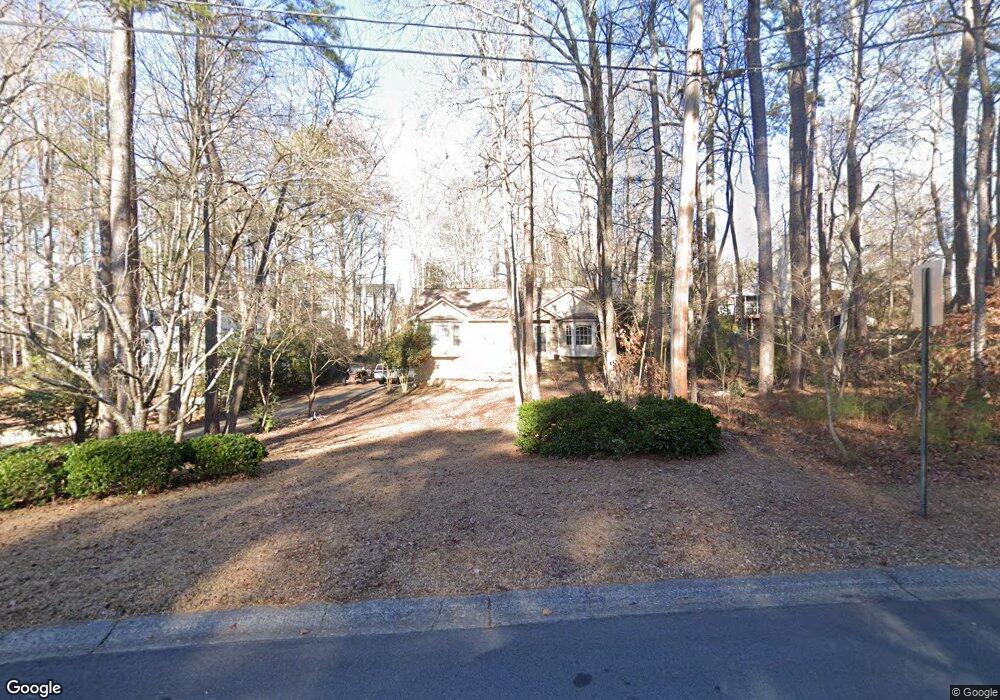
210 Crabapple Ln Powder Springs, GA 30127
West Cobb NeighborhoodEstimated Value: $329,011 - $360,000
3
Beds
2
Baths
1,782
Sq Ft
$191/Sq Ft
Est. Value
About This Home
This home is located at 210 Crabapple Ln, Powder Springs, GA 30127 and is currently estimated at $340,003, approximately $190 per square foot. 210 Crabapple Ln is a home located in Cobb County with nearby schools including Vaughan Elementary School, Lost Mountain Middle School, and Harrison High School.
Ownership History
Date
Name
Owned For
Owner Type
Purchase Details
Closed on
Aug 6, 2021
Sold by
Fant Preston L and Fant Catherine Leigh
Bought by
Collett Kristi A
Current Estimated Value
Home Financials for this Owner
Home Financials are based on the most recent Mortgage that was taken out on this home.
Original Mortgage
$199,500
Outstanding Balance
$180,737
Interest Rate
2.8%
Mortgage Type
New Conventional
Estimated Equity
$159,266
Purchase Details
Closed on
May 1, 1997
Sold by
Henderson Micheal T and Henderson Sharon B
Bought by
Fant Prestons L
Home Financials for this Owner
Home Financials are based on the most recent Mortgage that was taken out on this home.
Original Mortgage
$96,400
Interest Rate
5.45%
Mortgage Type
New Conventional
Purchase Details
Closed on
May 10, 1993
Sold by
Hickory Ent Inc
Bought by
Henderson Michael T
Home Financials for this Owner
Home Financials are based on the most recent Mortgage that was taken out on this home.
Original Mortgage
$104,950
Interest Rate
7.45%
Create a Home Valuation Report for This Property
The Home Valuation Report is an in-depth analysis detailing your home's value as well as a comparison with similar homes in the area
Home Values in the Area
Average Home Value in this Area
Purchase History
| Date | Buyer | Sale Price | Title Company |
|---|---|---|---|
| Collett Kristi A | $210,000 | Cedarcrest Title Llc | |
| Fant Prestons L | $120,500 | -- | |
| Henderson Michael T | $110,600 | -- |
Source: Public Records
Mortgage History
| Date | Status | Borrower | Loan Amount |
|---|---|---|---|
| Open | Collett Kristi A | $199,500 | |
| Previous Owner | Fant Prestons L | $96,400 | |
| Previous Owner | Henderson Michael T | $104,950 |
Source: Public Records
Tax History Compared to Growth
Tax History
| Year | Tax Paid | Tax Assessment Tax Assessment Total Assessment is a certain percentage of the fair market value that is determined by local assessors to be the total taxable value of land and additions on the property. | Land | Improvement |
|---|---|---|---|---|
| 2025 | $4,099 | $136,056 | $30,000 | $106,056 |
| 2024 | $4,102 | $136,056 | $30,000 | $106,056 |
| 2023 | $3,437 | $113,996 | $16,000 | $97,996 |
| 2022 | $3,460 | $113,996 | $16,000 | $97,996 |
| 2021 | $2,775 | $91,420 | $16,000 | $75,420 |
| 2020 | $2,590 | $85,328 | $16,000 | $69,328 |
| 2019 | $2,590 | $85,328 | $16,000 | $69,328 |
| 2018 | $2,164 | $71,288 | $7,200 | $64,088 |
| 2017 | $1,776 | $61,768 | $7,200 | $54,568 |
| 2016 | $1,403 | $61,768 | $7,200 | $54,568 |
| 2015 | $1,051 | $44,596 | $7,200 | $37,396 |
| 2014 | $1,060 | $44,596 | $0 | $0 |
Source: Public Records
Map
Nearby Homes
- 5585 Lavender Farms Rd
- 6049 Wyndham Woods Dr
- 409 Santa Ana Ct
- 5954 Henley Dr
- 219 Wyndhamwood Trail
- 5900 Pavillion Dr
- 582 Braidwood Dr NW
- 5904 Clairmont Way
- 128 Courtland Cir
- 6049 Braidwood Close NW Unit 5
- 260 Rockledge Bend SW
- 276 Rockledge Bend SW
- 284 Rockledge Bend SW
- 288 Rockledge Bend SW
- 306 Rockledge Bend SW
- 280 Rockledge Bend SW
- 139 Stanbrough Dr
- 212 Crabapple Ln
- 302 Crabapple Ct
- 300 Crabapple Ct
- 320 Calm Ct Unit 3
- 214 Crabapple Ln
- 290 Crabapple Ct
- 322 Calm Ct
- 300 Windswept Ct
- 300 Windswept Ct Unit 3
- 299 Crabapple Ct
- 205 Crabapple Ln
- 321 Calm Ct
- 211 Crabapple Ln
- 216 Crabapple Ln
- 302 Windswept Ct Unit 3
- 291 Crabapple Ct
- 280 Crabapple Ct
- 324 Calm Ct Unit 3
- 213 Crabapple Ln
- 203 Crabapple Ln Unit 2