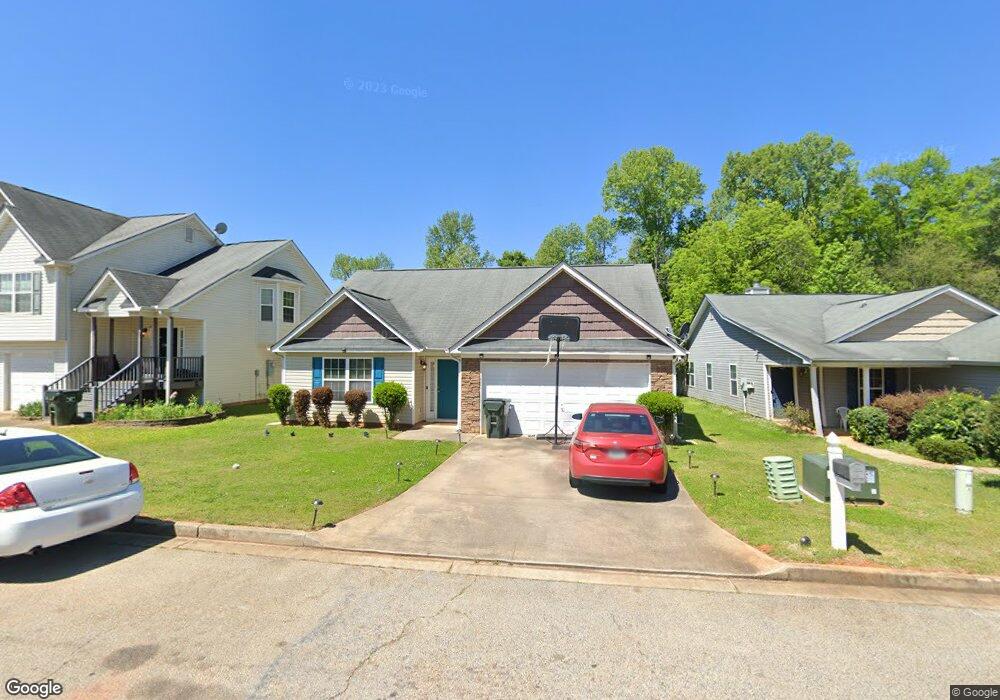
210 Creekside Manor Dr Thomaston, GA 30286
Estimated Value: $217,000 - $249,000
3
Beds
2
Baths
1,435
Sq Ft
$163/Sq Ft
Est. Value
About This Home
This home is located at 210 Creekside Manor Dr, Thomaston, GA 30286 and is currently estimated at $234,372, approximately $163 per square foot. 210 Creekside Manor Dr is a home located in Upson County with nearby schools including Upson-Lee South Elementary School, Upson-Lee North Elementary School, and Upson-Lee Middle School.
Ownership History
Date
Name
Owned For
Owner Type
Purchase Details
Closed on
May 17, 2013
Sold by
Gill Josee
Bought by
Whittaker Kristi W
Current Estimated Value
Home Financials for this Owner
Home Financials are based on the most recent Mortgage that was taken out on this home.
Original Mortgage
$69,740
Outstanding Balance
$48,904
Interest Rate
3.25%
Mortgage Type
FHA
Estimated Equity
$185,468
Purchase Details
Closed on
Feb 11, 2011
Sold by
Southeastern Real D
Bought by
Gill Josee
Home Financials for this Owner
Home Financials are based on the most recent Mortgage that was taken out on this home.
Original Mortgage
$63,200
Interest Rate
4.66%
Mortgage Type
New Conventional
Purchase Details
Closed on
May 22, 2007
Sold by
Blackhawk Development
Bought by
Sam Smith Homes Inc
Create a Home Valuation Report for This Property
The Home Valuation Report is an in-depth analysis detailing your home's value as well as a comparison with similar homes in the area
Home Values in the Area
Average Home Value in this Area
Purchase History
| Date | Buyer | Sale Price | Title Company |
|---|---|---|---|
| Whittaker Kristi W | $72,000 | -- | |
| Gill Josee | $79,000 | -- | |
| Sam Smith Homes Inc | -- | -- |
Source: Public Records
Mortgage History
| Date | Status | Borrower | Loan Amount |
|---|---|---|---|
| Open | Whittaker Kristi W | $69,740 | |
| Closed | Whittaker Kristi W | $7,500 | |
| Previous Owner | Gill Josee | $63,200 |
Source: Public Records
Tax History Compared to Growth
Tax History
| Year | Tax Paid | Tax Assessment Tax Assessment Total Assessment is a certain percentage of the fair market value that is determined by local assessors to be the total taxable value of land and additions on the property. | Land | Improvement |
|---|---|---|---|---|
| 2024 | $2,361 | $84,218 | $17,600 | $66,618 |
| 2023 | $2,406 | $75,892 | $17,600 | $58,292 |
| 2022 | $1,740 | $64,074 | $17,600 | $46,474 |
| 2021 | $1,276 | $46,270 | $6,000 | $40,270 |
| 2020 | $1,302 | $44,202 | $6,000 | $38,202 |
| 2019 | $1,257 | $41,043 | $6,000 | $35,043 |
| 2018 | $1,258 | $41,043 | $6,000 | $35,043 |
| 2017 | $1,011 | $30,343 | $4,893 | $25,450 |
| 2016 | $1,272 | $37,208 | $6,000 | $31,208 |
| 2015 | $1,262 | $37,208 | $6,000 | $31,208 |
| 2014 | $965 | $36,757 | $6,000 | $30,757 |
Source: Public Records
Map
Nearby Homes
- 201 Creekside Manor Dr
- LOT 193 Morningside Ct
- LOT 195 Morningside Ct
- LOT 194 Morningside Ct
- 1205 Shady Ln
- 108 Avenue G
- 113 Park Ln
- 87 Avenue H
- 221 Avenue L
- 1412 & 1418 Yatesville Hwy
- 354 S Main St
- 0 Traylor St
- 525 6th Ave
- 657 Tom McKinley Rd
- 203 Walter St
- 505 & 505 1/2 E Main St
- 500 E Main St
- 106 C St NE
- 705 Triune Mill Rd
- 114 C St NE
- 208 Creekside Manor Dr
- 212 Creekside Manor Dr
- 212 Creekside Manor Dr
- 214 Creekside Manor Dr
- 206 Creekside Manor Dr
- 216 Creekside Manor Dr
- 204 Creekside Manor Dr
- 185 Creekside Manor Dr
- 183 Creekside Manor Dr
- 186 Creekside Manor Dr
- 184 Creekside Manor Dr
- 182 Creekside Manor Dr
- 0 Creekside Manor Dr Unit 7360636
- 0 Creekside Manor Dr Unit 7154680
- 0 Creekside Manor Dr Unit 7002526
- 0 Creekside Manor Dr Unit 2991484
- 0 Creekside Manor Dr Unit 2991480
- 0 Creekside Manor Dr Unit LOT 185 9038824
- 0 Creekside Manor Dr Unit LOT 183 9038823
- 0 Creekside Manor Dr Unit LOT 186 9038821