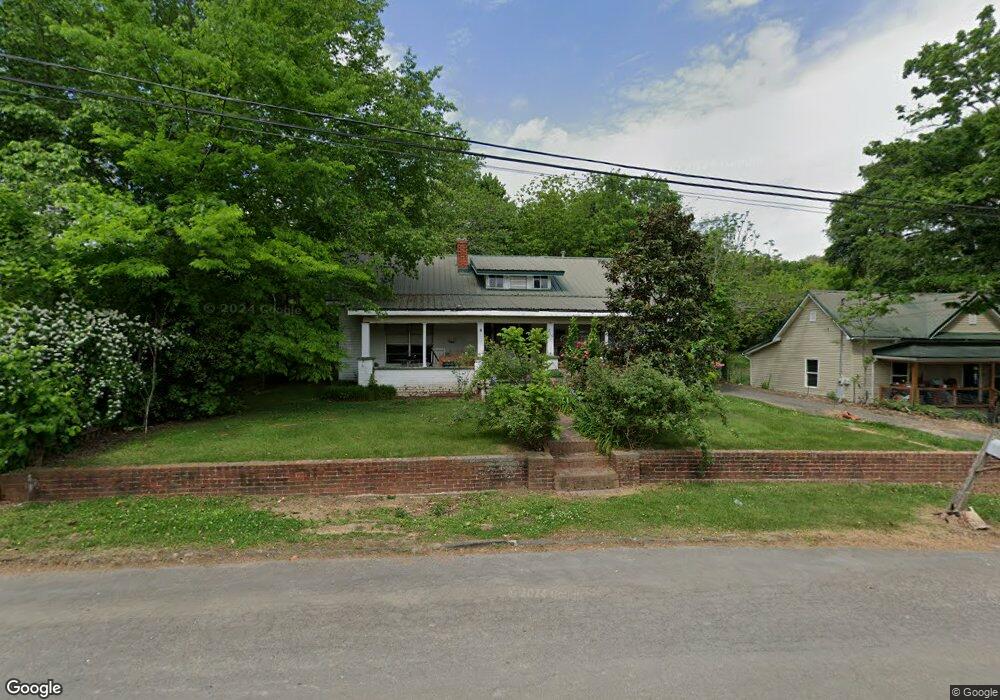
210 Daugherty St La Fayette, GA 30728
Estimated Value: $162,000 - $187,486
2
Beds
1
Bath
2,109
Sq Ft
$83/Sq Ft
Est. Value
About This Home
This home is located at 210 Daugherty St, La Fayette, GA 30728 and is currently estimated at $174,372, approximately $82 per square foot. 210 Daugherty St is a home located in Walker County with nearby schools including Gilbert Elementary School, Lafayette Middle School, and Lafayette High School.
Ownership History
Date
Name
Owned For
Owner Type
Purchase Details
Closed on
Mar 9, 2021
Sold by
Talbert Michael
Bought by
Talbert David A and Talbert Christopher
Current Estimated Value
Purchase Details
Closed on
Aug 23, 2007
Sold by
Wm Specialty Mtg Llc
Bought by
Talbert Michael
Purchase Details
Closed on
Nov 7, 2006
Sold by
Not Provided
Bought by
Talbert Michael
Purchase Details
Closed on
Dec 12, 2005
Sold by
Robinson Shelly B
Bought by
Robinson Charles E
Purchase Details
Closed on
May 26, 2000
Sold by
Amsouth Bank
Bought by
Robinson Charles E and Robinson Shelly B
Purchase Details
Closed on
Feb 1, 2000
Sold by
Turner Pamela D
Bought by
Amsouth Bank
Purchase Details
Closed on
Jul 27, 1998
Sold by
Cooper Larry and Cooper Juanita
Bought by
Turner Pamela D
Purchase Details
Closed on
Apr 3, 1998
Sold by
Lee Wm W
Bought by
Cooper Larry and Cooper Juanita
Purchase Details
Closed on
Sep 26, 1966
Bought by
Lee Wm W
Create a Home Valuation Report for This Property
The Home Valuation Report is an in-depth analysis detailing your home's value as well as a comparison with similar homes in the area
Home Values in the Area
Average Home Value in this Area
Purchase History
| Date | Buyer | Sale Price | Title Company |
|---|---|---|---|
| Talbert David A | -- | -- | |
| Talbert Michael | $34,000 | -- | |
| Talbert Michael | -- | -- | |
| Robinson Charles E | -- | -- | |
| Robinson Charles E | $60,000 | -- | |
| Amsouth Bank | -- | -- | |
| Turner Pamela D | $57,500 | -- | |
| Cooper Larry | $47,500 | -- | |
| Lee Wm W | -- | -- |
Source: Public Records
Tax History Compared to Growth
Tax History
| Year | Tax Paid | Tax Assessment Tax Assessment Total Assessment is a certain percentage of the fair market value that is determined by local assessors to be the total taxable value of land and additions on the property. | Land | Improvement |
|---|---|---|---|---|
| 2024 | $207 | $66,202 | $6,282 | $59,920 |
| 2023 | $176 | $63,056 | $6,282 | $56,774 |
| 2022 | $71 | $64,242 | $4,288 | $59,954 |
| 2021 | $735 | $27,015 | $3,015 | $24,000 |
| 2020 | $690 | $24,481 | $3,015 | $21,466 |
| 2019 | $690 | $24,481 | $3,015 | $21,466 |
| 2018 | $728 | $24,481 | $3,015 | $21,466 |
| 2017 | $755 | $24,481 | $3,015 | $21,466 |
| 2016 | $620 | $24,481 | $3,015 | $21,466 |
| 2015 | $698 | $26,126 | $2,972 | $23,154 |
| 2014 | $672 | $26,126 | $2,972 | $23,154 |
| 2013 | -- | $26,126 | $2,972 | $23,154 |
Source: Public Records
Map
Nearby Homes
- 301 Cedar St
- 306 Cedar St
- 316 Chestnut St
- 405 Magnolia St
- 702.5 Henderson St
- 317 Cedar St
- 312 Pine St
- 408 Chestnut St
- 204 S High St
- 205 Cavender St
- 506 Daugherty St
- 304 S Cherokee St
- 207 Culberson Ave
- 212 S High St
- 0 W Main St Unit 1518094
- 206 Glenn St
- 3 Fortune St
- 0 Fortune St Unit 1520483
- 21058 Georgia 193
- 505 Mclemore St
- 208 Daugherty St
- 214 Daugherty St
- 206 Daugherty St
- 204 Daugherty St
- 508 Thompson St
- 213 Daugherty St
- 207 Magnolia St
- 506 Thompson St
- 211 Daugherty St
- 55 Ann St
- 510 Thompson St
- 207 Daugherty St
- 202 Daugherty St
- 209 Magnolia St
- 205 Daugherty St
- 504 Thompson St
- 205 Magnolia St
- 512 Thompson St
- 301 Daugherty St
- 203 Daugherty St