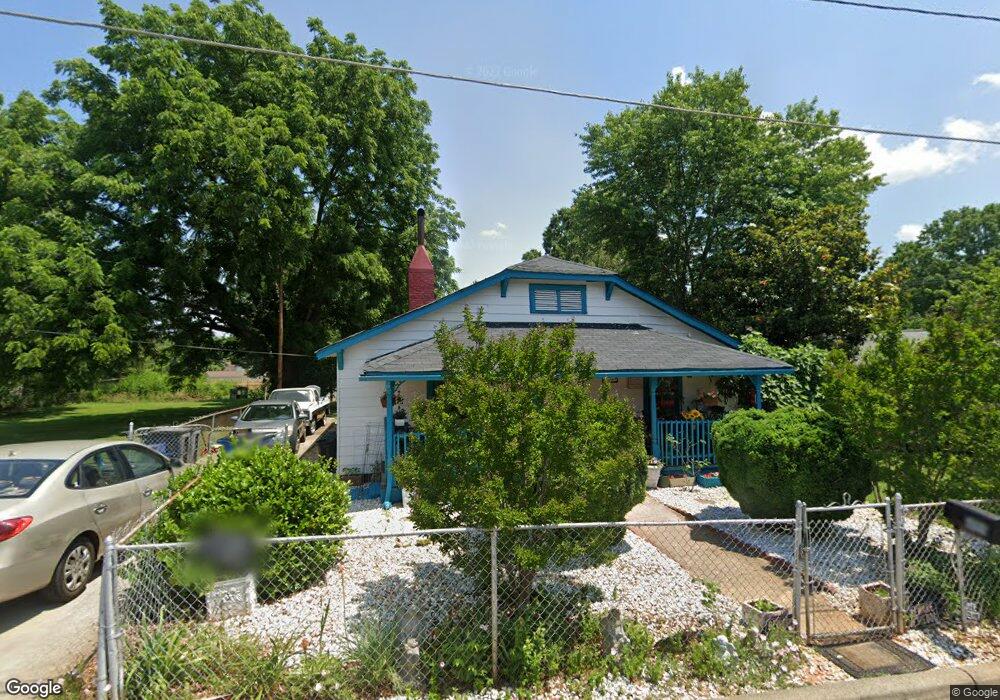
210 Deaton St Statesville, NC 28677
Estimated Value: $82,000 - $209,000
3
Beds
1
Bath
1,836
Sq Ft
$84/Sq Ft
Est. Value
About This Home
This home is located at 210 Deaton St, Statesville, NC 28677 and is currently estimated at $153,406, approximately $83 per square foot. 210 Deaton St is a home located in Iredell County with nearby schools including N.B. Mills Elementary School, Third Creek Middle School, and Statesville High School.
Ownership History
Date
Name
Owned For
Owner Type
Purchase Details
Closed on
Oct 20, 2022
Sold by
Gamble Rachel
Bought by
Gamble Rachel and Jones Gilbert
Current Estimated Value
Home Financials for this Owner
Home Financials are based on the most recent Mortgage that was taken out on this home.
Original Mortgage
$93,600
Outstanding Balance
$81,288
Interest Rate
5.96%
Mortgage Type
New Conventional
Estimated Equity
$72,118
Purchase Details
Closed on
Aug 10, 2004
Sold by
Gamble Rachel I and Eberhart Sonya M
Bought by
Gamble Rachel I and Eberhart Sonya M
Home Financials for this Owner
Home Financials are based on the most recent Mortgage that was taken out on this home.
Original Mortgage
$45,475
Interest Rate
5.97%
Mortgage Type
Stand Alone Refi Refinance Of Original Loan
Purchase Details
Closed on
Feb 1, 1995
Purchase Details
Closed on
Aug 1, 1991
Purchase Details
Closed on
Jun 1, 1966
Create a Home Valuation Report for This Property
The Home Valuation Report is an in-depth analysis detailing your home's value as well as a comparison with similar homes in the area
Home Values in the Area
Average Home Value in this Area
Purchase History
| Date | Buyer | Sale Price | Title Company |
|---|---|---|---|
| Gamble Rachel | -- | -- | |
| Gamble Rachel | -- | None Listed On Document | |
| Gamble Rachel I | -- | -- | |
| -- | $44,000 | -- | |
| -- | -- | -- | |
| -- | -- | -- |
Source: Public Records
Mortgage History
| Date | Status | Borrower | Loan Amount |
|---|---|---|---|
| Open | Gamble Rachel | $93,600 | |
| Closed | Gamble Rachel | $93,600 | |
| Previous Owner | Gamble Rachel I | $45,475 |
Source: Public Records
Tax History Compared to Growth
Tax History
| Year | Tax Paid | Tax Assessment Tax Assessment Total Assessment is a certain percentage of the fair market value that is determined by local assessors to be the total taxable value of land and additions on the property. | Land | Improvement |
|---|---|---|---|---|
| 2024 | $856 | $78,200 | $18,200 | $60,000 |
| 2023 | $856 | $78,200 | $18,200 | $60,000 |
| 2022 | $600 | $44,200 | $7,500 | $36,700 |
| 2021 | $656 | $44,200 | $7,500 | $36,700 |
| 2020 | $656 | $44,200 | $7,500 | $36,700 |
| 2019 | $651 | $44,200 | $7,500 | $36,700 |
| 2018 | $561 | $38,540 | $6,000 | $32,540 |
| 2017 | $553 | $38,540 | $6,000 | $32,540 |
| 2016 | $553 | $38,540 | $6,000 | $32,540 |
| 2015 | $413 | $38,540 | $6,000 | $32,540 |
| 2014 | $428 | $41,990 | $6,000 | $35,990 |
Source: Public Records
Map
Nearby Homes
- 266 N Lackey St
- 127 Bristol Rd
- 50 S Miller Ave Unit A
- 50 S Miller Ave Unit B
- 328 N Miller Ave
- 133 Buffalo Shoals Rd
- 440 N Oakland Ave
- 341 N Oak St
- 612 Stewart Ct
- 1261 Elizabeth Ave
- 1713 Forest Dr
- 732 W Front St
- 244 N Race St
- 636 Walnut St Unit C
- 1243 Mitchell Ave Unit 37
- 1245 Mitchell Ave
- 527 Alexander St
- 522 Alexander St
- 341 N Mulberry St
- 239 N Mulberry St
- 219 N Oakland Ave
- 231 N Oakland Ave
- 218 Deaton St
- 235 N Oakland Ave
- 222 Paola St
- 222 Deaton St
- 224 Deaton St
- 226 Deaton St
- 237 N Oakland Ave
- 241 N Oakland Ave
- 234 Deaton St
- 224 N Oakland Ave
- 226 N Oakland Ave
- 243 N Oakland Ave
- 230 N Oakland Ave
- 214 N Oakland Ave
- 234 N Oakland Ave
- 1134 Paola St
- 249 N Oakland Ave
- 240 N Oakland Ave