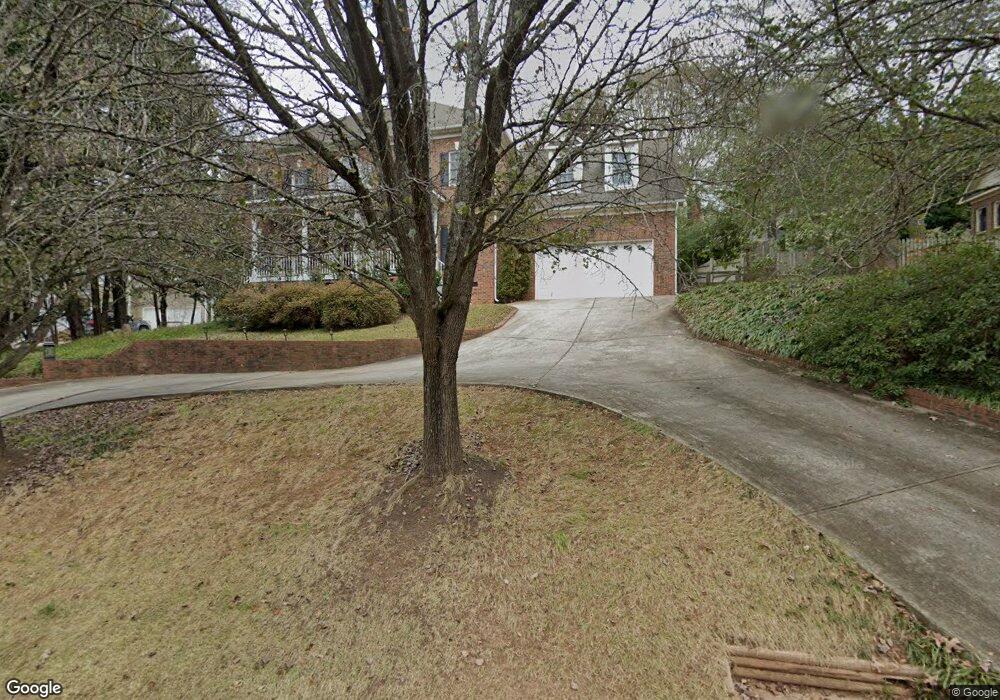
210 Deer Spring Ln Simpsonville, SC 29680
Estimated Value: $436,790 - $539,000
4
Beds
3
Baths
2,600
Sq Ft
$192/Sq Ft
Est. Value
About This Home
This home is located at 210 Deer Spring Ln, Simpsonville, SC 29680 and is currently estimated at $499,948, approximately $192 per square foot. 210 Deer Spring Ln is a home located in Greenville County with nearby schools including Plain Elementary, Ralph Chandler Middle, and Woodmont High School.
Ownership History
Date
Name
Owned For
Owner Type
Purchase Details
Closed on
Jul 28, 2025
Sold by
Dimitry Said and Dimitry Amira
Bought by
Dimitry Revocable Living Trust and Dimitry
Current Estimated Value
Purchase Details
Closed on
Sep 28, 2009
Sold by
Dimitry Said
Bought by
Dimitry Said and Dimitry Amira
Purchase Details
Closed on
Jul 9, 2009
Sold by
Hsbc Mortgage Services Inc
Bought by
Dimitry Said
Purchase Details
Closed on
Apr 27, 2009
Sold by
Balfour Christy
Bought by
Hsbc Mortgage Services Inc
Purchase Details
Closed on
May 10, 2006
Sold by
Balfour Paul H
Bought by
Balfour Christy
Home Financials for this Owner
Home Financials are based on the most recent Mortgage that was taken out on this home.
Original Mortgage
$56,000
Interest Rate
6.39%
Mortgage Type
Stand Alone Second
Purchase Details
Closed on
Apr 28, 2005
Sold by
Elmore Kenneth Lee
Bought by
Balfour Paul H
Home Financials for this Owner
Home Financials are based on the most recent Mortgage that was taken out on this home.
Original Mortgage
$239,900
Interest Rate
5.99%
Mortgage Type
New Conventional
Create a Home Valuation Report for This Property
The Home Valuation Report is an in-depth analysis detailing your home's value as well as a comparison with similar homes in the area
Home Values in the Area
Average Home Value in this Area
Purchase History
| Date | Buyer | Sale Price | Title Company |
|---|---|---|---|
| Dimitry Revocable Living Trust | -- | None Listed On Document | |
| Dimitry Revocable Living Trust | -- | None Listed On Document | |
| Dimitry Revocable Living Trust | -- | None Listed On Document | |
| Dimitry Said | -- | -- | |
| Dimitry Said | $190,000 | -- | |
| Hsbc Mortgage Services Inc | $2,500 | -- | |
| Balfour Christy | -- | None Available | |
| Balfour Paul H | $239,900 | -- |
Source: Public Records
Mortgage History
| Date | Status | Borrower | Loan Amount |
|---|---|---|---|
| Previous Owner | Balfour Christy | $31,498 | |
| Previous Owner | Balfour Christy | $56,000 | |
| Previous Owner | Balfour Paul H | $224,000 | |
| Previous Owner | Balfour Paul H | $239,900 |
Source: Public Records
Tax History Compared to Growth
Tax History
| Year | Tax Paid | Tax Assessment Tax Assessment Total Assessment is a certain percentage of the fair market value that is determined by local assessors to be the total taxable value of land and additions on the property. | Land | Improvement |
|---|---|---|---|---|
| 2024 | $1,318 | $10,350 | $1,600 | $8,750 |
| 2023 | $1,318 | $10,350 | $1,600 | $8,750 |
| 2022 | $1,285 | $10,350 | $1,600 | $8,750 |
| 2021 | $1,286 | $10,350 | $1,600 | $8,750 |
| 2020 | $1,173 | $9,220 | $1,280 | $7,940 |
| 2019 | $1,173 | $9,220 | $1,280 | $7,940 |
| 2018 | $1,226 | $9,220 | $1,280 | $7,940 |
| 2017 | $1,227 | $9,220 | $1,280 | $7,940 |
| 2016 | $1,181 | $230,430 | $32,000 | $198,430 |
| 2015 | $1,206 | $234,250 | $32,000 | $202,250 |
| 2014 | $1,097 | $225,590 | $34,000 | $191,590 |
Source: Public Records
Map
Nearby Homes
- 230 Deer Spring Ln
- 109 Deer Spring Ln
- 4 Deer Spring Ln
- 633 Neely Farm Dr
- 8 Atchison Way
- 116 Eben Way Ln
- 6 Woodbluff Place
- 1 Indian Laurel Ct
- 18 Ebenway Ln
- 5 Whiffletree Dr
- 406 Windwood St
- 210 Bank Swallow Way
- 1 Mallard Ridge Place
- 315 Hunslet Way
- 23 Shefleys Rd
- 7 Dapple Gray Ct
- 124 Bentwater Trail
- 613 Whitemarsh Ave
- 14 Foxmoor Ct
- 905 Morning Mist Ln
- 214 Deer Spring Ln
- 3 Weatherly Ct
- 204 Deer Spring Ln
- 5 Weatherly Ct
- 218 Deer Spring Ln
- 211 Deer Spring Ln
- 11 Huntsman Ct
- 207 Deer Spring Ln
- 215 Deer Spring Ln
- 7 Huntsman Ct
- 9 Weatherly Ct
- 203 Deer Spring Ln
- 222 Deer Spring Ln
- 10 Huntsman Ct
- 4 Weatherly Ct
- 223 Deer Spring Ln
- 6 Weatherly Ct
- 5 Huntsman Ct
- 2 Weatherly Ct
- 201 Deer Spring Ln