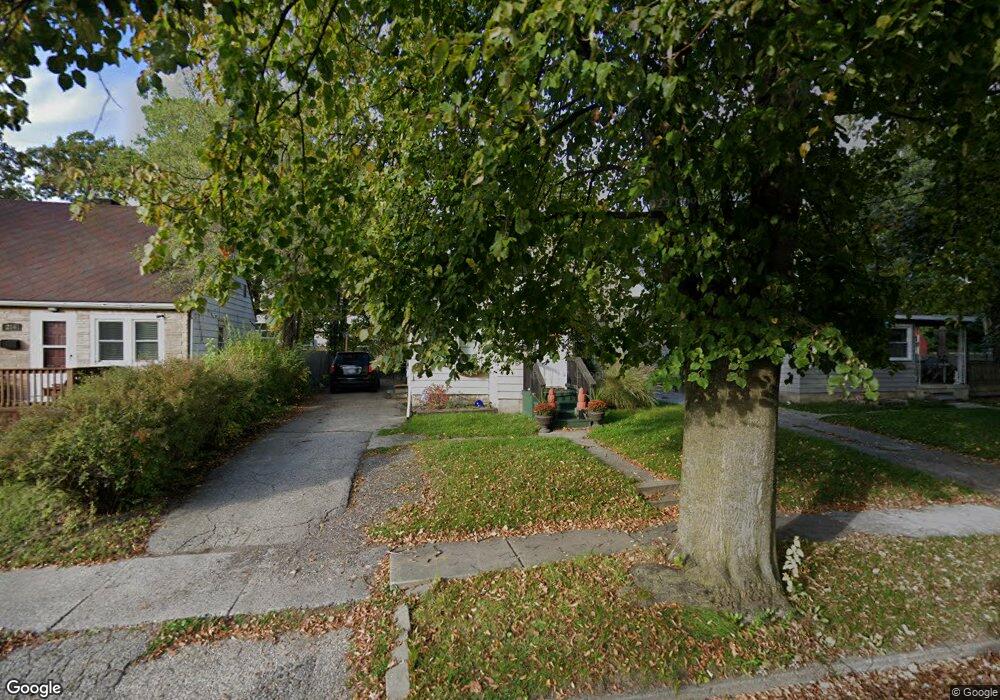
210 Dunlap St Lansing, MI 48910
Old Everett NeighborhoodEstimated Value: $96,320 - $115,000
3
Beds
1
Bath
798
Sq Ft
$131/Sq Ft
Est. Value
About This Home
This home is located at 210 Dunlap St, Lansing, MI 48910 and is currently estimated at $104,580, approximately $131 per square foot. 210 Dunlap St is a home located in Ingham County with nearby schools including Lyons Elementary School, Attwood School, and Everett High School.
Ownership History
Date
Name
Owned For
Owner Type
Purchase Details
Closed on
Jun 12, 2008
Sold by
King Brad J and Cribley Nichole L
Bought by
Us Bank Na and Lehman Brothers Structured Asset Securit
Current Estimated Value
Purchase Details
Closed on
May 12, 2006
Sold by
King Brad J
Bought by
King Brad J and Cribley Nichole L
Home Financials for this Owner
Home Financials are based on the most recent Mortgage that was taken out on this home.
Original Mortgage
$106,875
Interest Rate
6.54%
Mortgage Type
Stand Alone Refi Refinance Of Original Loan
Purchase Details
Closed on
Oct 25, 2002
Sold by
Tomlian Janice
Bought by
King Brad J
Home Financials for this Owner
Home Financials are based on the most recent Mortgage that was taken out on this home.
Original Mortgage
$56,119
Interest Rate
6.1%
Mortgage Type
FHA
Purchase Details
Closed on
Jul 29, 1997
Sold by
Hilton Leon
Bought by
Tomlian Janice A
Create a Home Valuation Report for This Property
The Home Valuation Report is an in-depth analysis detailing your home's value as well as a comparison with similar homes in the area
Home Values in the Area
Average Home Value in this Area
Purchase History
| Date | Buyer | Sale Price | Title Company |
|---|---|---|---|
| Us Bank Na | $54,000 | None Available | |
| King Brad J | -- | Bell Title Company | |
| King Brad J | $57,000 | Midstate Title Company | |
| Tomlian Janice | $30,100 | Midstate Title Company | |
| Tomlian Janice A | $30,100 | -- |
Source: Public Records
Mortgage History
| Date | Status | Borrower | Loan Amount |
|---|---|---|---|
| Previous Owner | King Brad J | $106,875 | |
| Previous Owner | King Brad J | $56,119 |
Source: Public Records
Tax History
| Year | Tax Paid | Tax Assessment Tax Assessment Total Assessment is a certain percentage of the fair market value that is determined by local assessors to be the total taxable value of land and additions on the property. | Land | Improvement |
|---|---|---|---|---|
| 2025 | $2,078 | $43,600 | $5,800 | $37,800 |
| 2024 | $17 | $35,600 | $5,800 | $29,800 |
| 2023 | $1,957 | $31,300 | $5,800 | $25,500 |
| 2022 | $1,789 | $27,200 | $5,800 | $21,400 |
| 2021 | $1,748 | $25,000 | $2,900 | $22,100 |
| 2020 | $1,735 | $23,500 | $2,900 | $20,600 |
| 2019 | $1,674 | $22,600 | $2,900 | $19,700 |
| 2018 | $1,589 | $20,400 | $2,900 | $17,500 |
| 2017 | $1,529 | $20,400 | $2,900 | $17,500 |
| 2016 | $1,558 | $20,100 | $2,900 | $17,200 |
| 2015 | $1,558 | $19,400 | $5,799 | $13,601 |
| 2014 | $1,558 | $19,300 | $3,479 | $15,821 |
Source: Public Records
Map
Nearby Homes
- 215 Dunlap St
- 218 Dunlap St
- 334 Dunlap St
- 410 Dunlap St
- 3209 Stabler St
- 3115 Palmer St
- 114 W Berry Ave
- 320 E Hodge Ave
- 0 Rickle
- 2600 Maplewood Ave
- 413 E Hodge Ave
- 416 W Holmes Rd
- 3319 Jewell Ave
- 725 Dunlap St
- 3310 Ellen Ave
- 560 Paris Ave
- 3429 Lowcroft Ave
- 3439 Lowcroft Ave
- 924 Loa St
- 555 Tisdale Ave
Your Personal Tour Guide
Ask me questions while you tour the home.