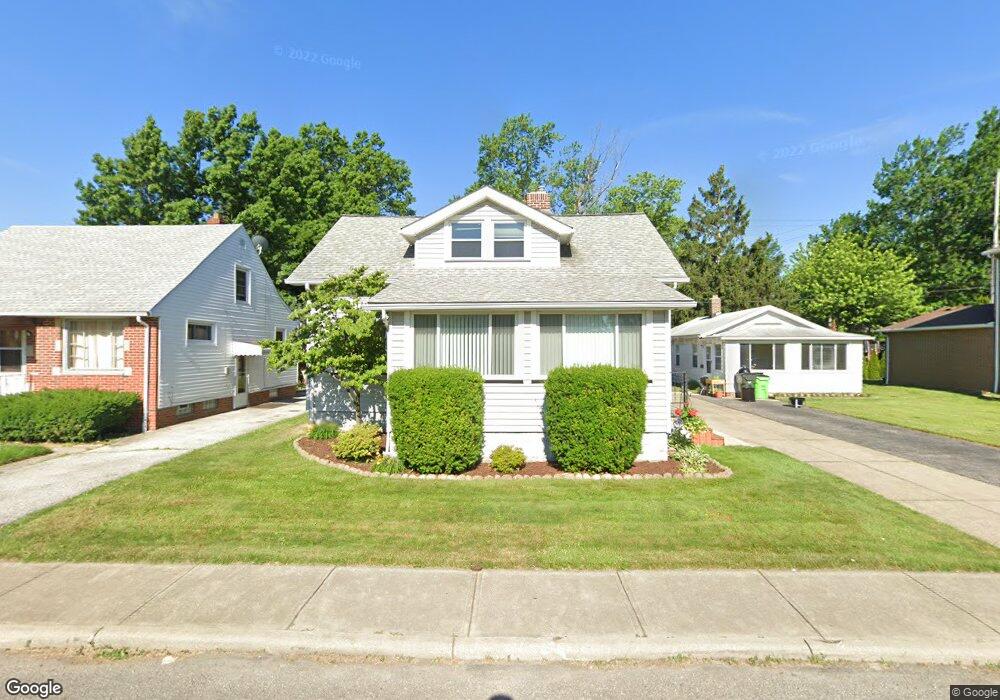
210 E 238th St Euclid, OH 44123
Estimated Value: $107,000 - $217,000
2
Beds
1
Bath
1,300
Sq Ft
$104/Sq Ft
Est. Value
About This Home
This home is located at 210 E 238th St, Euclid, OH 44123 and is currently estimated at $135,267, approximately $104 per square foot. 210 E 238th St is a home located in Cuyahoga County with nearby schools including Bluestone Elementary School, Euclid High School, and Pinnacle Academy.
Ownership History
Date
Name
Owned For
Owner Type
Purchase Details
Closed on
Nov 15, 2017
Sold by
Yearick Deborah A and Hilscher Formerly Deborah A
Bought by
Yearick Deborah and Yearick Timothy
Current Estimated Value
Home Financials for this Owner
Home Financials are based on the most recent Mortgage that was taken out on this home.
Original Mortgage
$45,314
Outstanding Balance
$24,976
Interest Rate
3.94%
Mortgage Type
New Conventional
Estimated Equity
$110,291
Purchase Details
Closed on
Feb 4, 1987
Sold by
Yearick Timothy
Bought by
Yearick Timothy and Yearick Hilsher D
Purchase Details
Closed on
Mar 4, 1985
Sold by
Yearick Timothy
Bought by
Yearick Timothy
Purchase Details
Closed on
Dec 10, 1984
Sold by
Yearick Timothy
Bought by
Yearick Timothy
Purchase Details
Closed on
Mar 12, 1980
Sold by
Bowins Joseph R
Bought by
Yearick Timothy
Purchase Details
Closed on
Jun 8, 1979
Sold by
Bowins Joseph R and Bowins Sadie
Bought by
Bowins Joseph R
Purchase Details
Closed on
Jan 1, 1975
Bought by
Bowins Joseph R and Bowins Sadie
Create a Home Valuation Report for This Property
The Home Valuation Report is an in-depth analysis detailing your home's value as well as a comparison with similar homes in the area
Home Values in the Area
Average Home Value in this Area
Purchase History
| Date | Buyer | Sale Price | Title Company |
|---|---|---|---|
| Yearick Deborah | -- | None Available | |
| Yearick Timothy | -- | -- | |
| Yearick Timothy | -- | -- | |
| Yearick Timothy | -- | -- | |
| Yearick Timothy | -- | -- | |
| Bowins Joseph R | -- | -- | |
| Bowins Joseph R | -- | -- |
Source: Public Records
Mortgage History
| Date | Status | Borrower | Loan Amount |
|---|---|---|---|
| Open | Yearick Deborah | $45,314 |
Source: Public Records
Tax History
| Year | Tax Paid | Tax Assessment Tax Assessment Total Assessment is a certain percentage of the fair market value that is determined by local assessors to be the total taxable value of land and additions on the property. | Land | Improvement |
|---|---|---|---|---|
| 2024 | $2,306 | $33,040 | $6,615 | $26,425 |
| 2023 | $1,630 | $18,140 | $4,800 | $13,340 |
| 2022 | $1,594 | $18,130 | $4,800 | $13,340 |
| 2021 | $1,771 | $18,130 | $4,800 | $13,340 |
| 2020 | $1,797 | $16,800 | $4,450 | $12,360 |
| 2019 | $1,611 | $48,000 | $12,700 | $35,300 |
| 2018 | $1,645 | $16,800 | $4,450 | $12,360 |
| 2017 | $3,053 | $27,200 | $4,340 | $22,860 |
| 2016 | $3,060 | $27,200 | $4,340 | $22,860 |
| 2015 | $2,785 | $27,200 | $4,340 | $22,860 |
| 2014 | $2,785 | $27,200 | $4,340 | $22,860 |
Source: Public Records
Map
Nearby Homes
- 244 E 238th St
- 110 E 238th St
- 71 Lake Edge Dr
- 303 E 235th St
- 323 E 235th St
- 325 E 244th St
- 334 E 238th St
- 324 E 235th St
- 368 E 248th St
- 24891 Zeman Ave
- 23298 Williams Ave
- 55 Sunnycliff Dr
- 464 E 250th St
- 25151 Zeman Ave
- 364 Walworth Ave
- 110 E 252nd St
- 515 E 250th St
- 23198 Gay St
- 25401 Farringdon Ave
- 24181 Devoe Ave
- 220 E 238th St
- 208 E 238th St
- 222 E 238th St
- 23740 Lakeshore Blvd
- 23740 Lake Shore Blvd
- 23740 Lake Shore Blvd
- 23740 Lake Shore Blvd Unit 2
- 226 E 238th St
- 23600 Lake Shore Blvd Unit 34
- 23620 Lake Shore Blvd
- 23630 Lake Shore Blvd
- 23620 Lake Shore Blvd Unit 35
- 211 E 238th St
- 221 E 238th St
- 23802 Lake Shore Blvd
- 230 E 238th St
- 225 E 238th St
- 238 E 216th St
- 23566 Lake Shore Blvd Unit 31
- 23560 Lake Shore Blvd
Your Personal Tour Guide
Ask me questions while you tour the home.