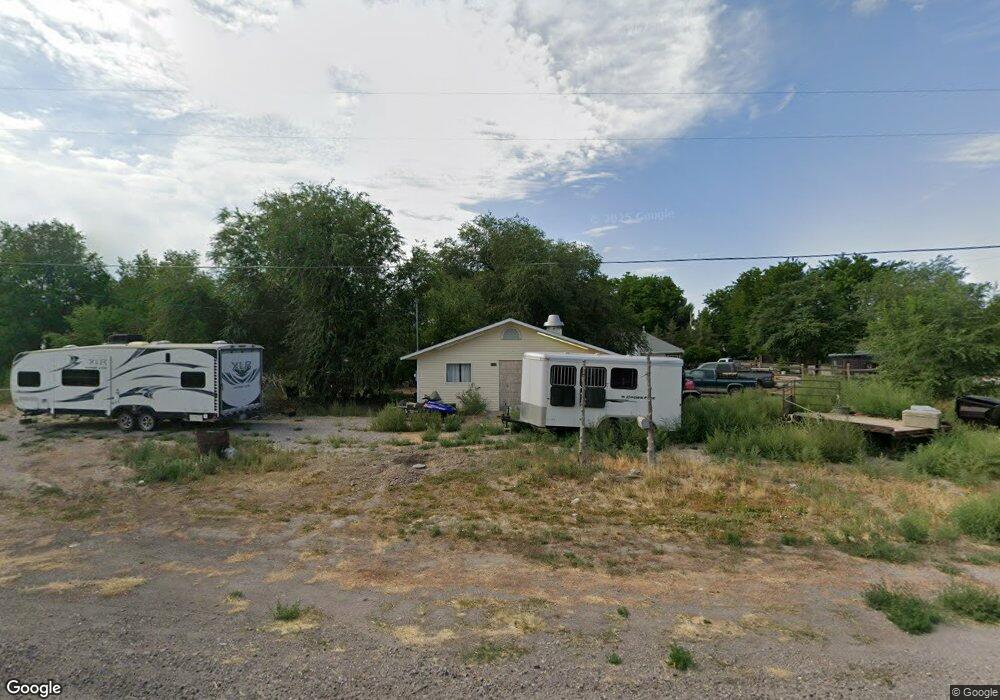
210 E 500 N Hinckley, UT 84635
Estimated Value: $146,000 - $206,000
Studio
--
Bath
1,140
Sq Ft
$162/Sq Ft
Est. Value
About This Home
This home is located at 210 E 500 N, Hinckley, UT 84635 and is currently estimated at $184,993, approximately $162 per square foot. 210 E 500 N is a home located in Millard County.
Ownership History
Date
Name
Owned For
Owner Type
Purchase Details
Closed on
Jul 22, 2021
Sold by
Cooper Martin
Bought by
Cooper Martin and Cooper Nicole Brinkerhoff
Current Estimated Value
Home Financials for this Owner
Home Financials are based on the most recent Mortgage that was taken out on this home.
Original Mortgage
$94,000
Outstanding Balance
$84,631
Interest Rate
2.96%
Mortgage Type
New Conventional
Estimated Equity
$100,362
Purchase Details
Closed on
Jan 4, 2021
Sold by
Bench Thomas
Bought by
Martin Cooper
Purchase Details
Closed on
Mar 8, 2019
Sold by
Nielsen Steven D
Bought by
Bench Thomas
Create a Home Valuation Report for This Property
The Home Valuation Report is an in-depth analysis detailing your home's value as well as a comparison with similar homes in the area
Purchase History
| Date | Buyer | Sale Price | Title Company |
|---|---|---|---|
| Cooper Martin | -- | First American Title | |
| Martin Cooper | -- | First American Title | |
| Bench Thomas | -- | First American Title |
Source: Public Records
Mortgage History
| Date | Status | Borrower | Loan Amount |
|---|---|---|---|
| Open | Cooper Martin | $94,000 |
Source: Public Records
Tax History
| Year | Tax Paid | Tax Assessment Tax Assessment Total Assessment is a certain percentage of the fair market value that is determined by local assessors to be the total taxable value of land and additions on the property. | Land | Improvement |
|---|---|---|---|---|
| 2025 | $870 | $103,616 | $15,001 | $88,615 |
| 2024 | $870 | $96,881 | $5,717 | $91,164 |
| 2023 | $1,030 | $96,881 | $5,717 | $91,164 |
| 2022 | $675 | $57,005 | $5,405 | $51,600 |
| 2021 | $453 | $36,402 | $4,331 | $32,071 |
| 2020 | $834 | $67,312 | $8,500 | $58,812 |
| 2019 | $913 | $74,388 | $8,500 | $65,888 |
| 2018 | $854 | $71,358 | $8,500 | $62,858 |
| 2017 | $890 | $71,358 | $8,500 | $62,858 |
| 2016 | $852 | $71,358 | $8,500 | $62,858 |
| 2015 | $842 | $70,320 | $8,500 | $61,820 |
| 2014 | -- | $70,320 | $8,500 | $61,820 |
| 2013 | -- | $68,519 | $8,500 | $60,019 |
Source: Public Records
Map
Nearby Homes
- 289 W Center St S
- 291 W Center St
- 30 S 800 West Rd
- 861 W 75 S
- 700 Acres
- 1500 S 10000 W
- 6000 N 10000 W
- 7560 W 8500 N
- 4500 N 10000 W
- 850 W 15900 N
- 4500 N 9000 W
- 700 Acres Hwy 6 & Main St (Hwy 50)
- 2000 E 10500 N
- 6200 S 3000 W
- 18000 W Hwy 50 6
- 3480 S 4000 W
- 6177 S 3000 Rd W
- 4265 S 4000 W
- Tbd 7000 W Rd
- 3885 W 4500 S
Your Personal Tour Guide
Ask me questions while you tour the home.