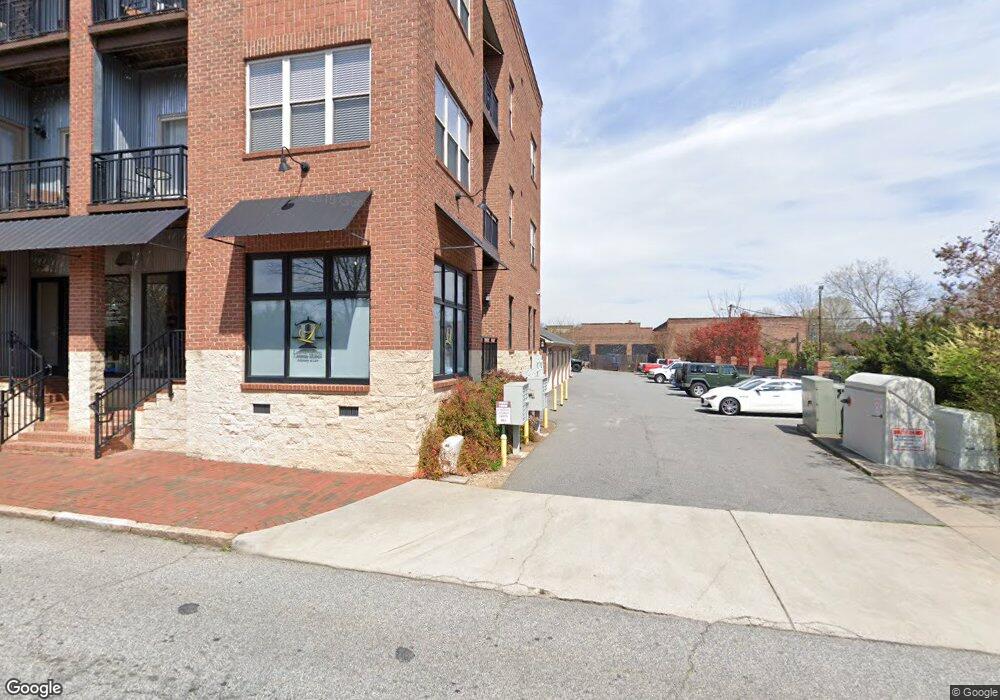
210 E Fisher St Unit 10 Salisbury, NC 28144
Estimated Value: $216,199 - $281,000
--
Bed
2
Baths
1,424
Sq Ft
$183/Sq Ft
Est. Value
About This Home
This home is located at 210 E Fisher St Unit 10, Salisbury, NC 28144 and is currently estimated at $260,050, approximately $182 per square foot. 210 E Fisher St Unit 10 is a home located in Rowan County with nearby schools including Carroll T Overton Elementary School, Knox Middle School, and North Rowan Middle School.
Ownership History
Date
Name
Owned For
Owner Type
Purchase Details
Closed on
Jul 21, 2020
Sold by
Clayton Andrew R and Clayton Rebecca R
Bought by
Moscardini Gianni and Moscardini Mona R
Current Estimated Value
Home Financials for this Owner
Home Financials are based on the most recent Mortgage that was taken out on this home.
Original Mortgage
$124,000
Outstanding Balance
$87,805
Interest Rate
3.2%
Mortgage Type
New Conventional
Estimated Equity
$172,245
Purchase Details
Closed on
Jun 9, 2011
Sold by
Spear Investments Llc
Bought by
Clayton Rebecca and Clayton Andrew
Purchase Details
Closed on
Aug 13, 2008
Sold by
Town Square Development Llc
Bought by
Spear Investments Llc
Home Financials for this Owner
Home Financials are based on the most recent Mortgage that was taken out on this home.
Original Mortgage
$243,600
Interest Rate
6.32%
Mortgage Type
Purchase Money Mortgage
Create a Home Valuation Report for This Property
The Home Valuation Report is an in-depth analysis detailing your home's value as well as a comparison with similar homes in the area
Home Values in the Area
Average Home Value in this Area
Purchase History
| Date | Buyer | Sale Price | Title Company |
|---|---|---|---|
| Moscardini Gianni | $150,000 | None Available | |
| Clayton Rebecca | $173,000 | None Available | |
| Spear Investments Llc | -- | None Available |
Source: Public Records
Mortgage History
| Date | Status | Borrower | Loan Amount |
|---|---|---|---|
| Open | Moscardini Gianni | $124,000 | |
| Previous Owner | Spear Investments Llc | $243,600 |
Source: Public Records
Tax History Compared to Growth
Tax History
| Year | Tax Paid | Tax Assessment Tax Assessment Total Assessment is a certain percentage of the fair market value that is determined by local assessors to be the total taxable value of land and additions on the property. | Land | Improvement |
|---|---|---|---|---|
| 2025 | $1,572 | $213,613 | $104 | $213,509 |
| 2024 | $1,572 | $213,613 | $104 | $213,509 |
| 2023 | $1,990 | $213,613 | $104 | $213,509 |
| 2022 | $2,468 | $158,885 | $1,200 | $157,685 |
| 2021 | $2,468 | $158,885 | $1,200 | $157,685 |
| 2020 | $2,468 | $158,885 | $1,200 | $157,685 |
| 2019 | $2,468 | $158,885 | $1,200 | $157,685 |
| 2018 | $2,727 | $178,017 | $1 | $178,016 |
| 2017 | $2,715 | $178,017 | $1 | $178,016 |
| 2016 | $2,529 | $169,976 | $1 | $169,975 |
| 2015 | $2,547 | $169,976 | $1 | $169,975 |
| 2014 | $2,617 | $176,568 | $1 | $176,567 |
Source: Public Records
Map
Nearby Homes
- 119 S Lee St Unit 3
- 123 N Main St
- 209 S Main St
- 0 Brown St
- 300 S Main St Unit K
- 409 E Fisher St
- 420 E Bank St
- 322 S Church St
- 500 W Council St
- 403 S Long St
- 301 S Shaver St
- 501 S Main St
- 300 W Horah St
- 301 N Fulton St
- 507 Park Ave
- 420 S Jackson St
- 316 N Clay St
- 613 E Liberty St
- 1040 Beckham Rd
- 1210 Kildare Dr Unit 80
- 210 E Fisher St Unit 210
- 216 E Fisher St Unit 16
- 212 E Fisher St Unit 11
- 135 S Lee St
- 135 S Lee St
- 135 S Lee St
- 204 E Fisher St Unit 5
- 206 E Fisher St Unit 6
- 214 E Fisher St Unit 15
- 137 S Lee St
- 137 S Lee St Unit 13
- 125 S Lee St
- 125 S Lee St Unit 12
- 127 S Lee St
- 127 S Lee St
- 202 E Fisher St Unit 4
- 139 S Lee St Unit 14
- 115 S Lee St
- 129 S Lee St Unit 9
- 119 S Lee St Unit NULL