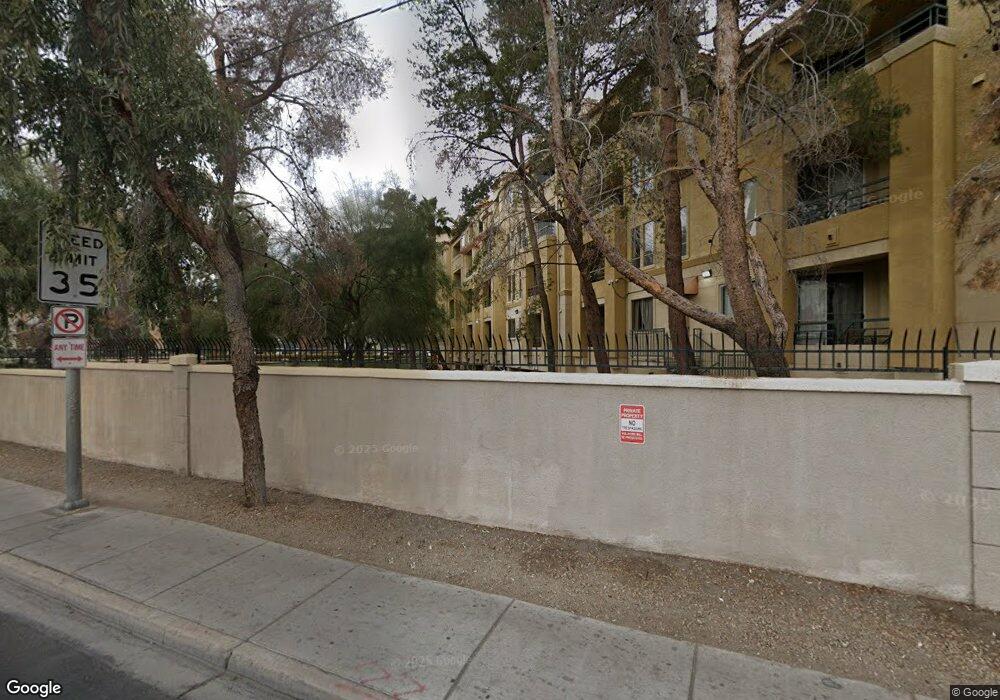
Meridian Luxury Condos 210 E Flamingo Rd Unit 135 Las Vegas, NV 89169
The Strip NeighborhoodEstimated Value: $248,636 - $332,000
1
Bed
1
Bath
727
Sq Ft
$375/Sq Ft
Est. Value
About This Home
This home is located at 210 E Flamingo Rd Unit 135, Las Vegas, NV 89169 and is currently estimated at $272,909, approximately $375 per square foot. 210 E Flamingo Rd Unit 135 is a home located in Clark County with nearby schools including Paradise Elementary School, William E. Orr Middle School, and Valley High School.
Ownership History
Date
Name
Owned For
Owner Type
Purchase Details
Closed on
May 26, 2017
Sold by
Barber Jeff
Bought by
Filice Frank and Filice Silvana
Current Estimated Value
Purchase Details
Closed on
Feb 26, 2009
Sold by
The Bank Of New York
Bought by
Barber Jeff
Purchase Details
Closed on
Oct 28, 2008
Sold by
Bjornholm Dolores
Bought by
The Bank Of New York
Purchase Details
Closed on
Jan 30, 2006
Sold by
Bjornholm Robert
Bought by
Bjornholm Dolores
Home Financials for this Owner
Home Financials are based on the most recent Mortgage that was taken out on this home.
Original Mortgage
$311,863
Interest Rate
6.21%
Mortgage Type
Stand Alone Refi Refinance Of Original Loan
Purchase Details
Closed on
Dec 30, 2005
Sold by
Koval Flamingo Llc
Bought by
Bjomholm Dolores
Home Financials for this Owner
Home Financials are based on the most recent Mortgage that was taken out on this home.
Original Mortgage
$311,863
Interest Rate
6.21%
Mortgage Type
Stand Alone Refi Refinance Of Original Loan
Create a Home Valuation Report for This Property
The Home Valuation Report is an in-depth analysis detailing your home's value as well as a comparison with similar homes in the area
Home Values in the Area
Average Home Value in this Area
Purchase History
| Date | Buyer | Sale Price | Title Company |
|---|---|---|---|
| Filice Frank | $150,000 | First American Title Ins | |
| Barber Jeff | $94,500 | First American Title Paseo V | |
| The Bank Of New York | $144,500 | First American Title Ins Co | |
| Bjornholm Dolores | -- | First Amer Title Co Of Nv | |
| Bjomholm Dolores | $394,764 | First Amer Title Co Of Nv |
Source: Public Records
Mortgage History
| Date | Status | Borrower | Loan Amount |
|---|---|---|---|
| Previous Owner | Bjornholm Dolores | $311,863 | |
| Previous Owner | Bjomholm Dolores | $63,162 |
Source: Public Records
Tax History Compared to Growth
Tax History
| Year | Tax Paid | Tax Assessment Tax Assessment Total Assessment is a certain percentage of the fair market value that is determined by local assessors to be the total taxable value of land and additions on the property. | Land | Improvement |
|---|---|---|---|---|
| 2025 | $1,254 | $47,012 | $23,310 | $23,702 |
| 2024 | $1,161 | $47,012 | $23,310 | $23,702 |
| 2023 | $1,161 | $50,664 | $28,035 | $22,629 |
| 2022 | $1,076 | $42,047 | $20,475 | $21,572 |
| 2021 | $996 | $41,013 | $20,475 | $20,538 |
| 2020 | $922 | $40,564 | $19,845 | $20,719 |
| 2019 | $864 | $37,978 | $17,640 | $20,338 |
| 2018 | $825 | $30,486 | $10,395 | $20,091 |
| 2017 | $892 | $30,422 | $9,765 | $20,657 |
| 2016 | $773 | $29,610 | $9,450 | $20,160 |
| 2015 | $770 | $25,483 | $6,930 | $18,553 |
| 2014 | $748 | $26,701 | $6,930 | $19,771 |
Source: Public Records
About Meridian Luxury Condos
Map
Nearby Homes
- 220 E Flamingo Rd Unit 111
- 220 E Flamingo Rd Unit 125
- 220 E Flamingo Rd Unit 202
- 220 E Flamingo Rd Unit 227
- 220 E Flamingo Rd Unit 426
- 220 E Flamingo Rd Unit 317
- 220 E Flamingo Rd Unit 116
- 220 E Flamingo Rd Unit 104
- 220 E Flamingo Rd Unit 402
- 270 E Flamingo Rd Unit 418
- 270 E Flamingo Rd Unit 115
- 270 E Flamingo Rd Unit 136
- 270 E Flamingo Rd Unit 333
- 260 E Flamingo Rd Unit 308
- 270 E Flamingo Rd Unit 205
- 270 E Flamingo Rd Unit 107
- 270 E Flamingo Rd Unit 223
- 210 E Flamingo Rd Unit 105
- 210 E Flamingo Rd Unit 218
- 210 E Flamingo Rd Unit 113
- 210 E Flamingo Rd
- 210 E Flamingo Rd Unit 1305
- 210 E Flamingo Rd Unit 1129
- 210 E Flamingo Rd Unit 237
- 210 E Flamingo Rd Unit 221
- 210 E Flamingo Rd Unit 328
- 210 E Flamingo Rd Unit 421
- 210 E Flamingo Rd Unit 217
- 210 E Flamingo Rd Unit 337
- 210 E Flamingo Rd Unit 208
- 210 E Flamingo Rd Unit 214
- 210 E Flamingo Rd Unit 406
- 210 E Flamingo Rd Unit 418
- 210 E Flamingo Rd Unit 334
- 210 E Flamingo Rd Unit 137
- 210 E Flamingo Rd Unit 1201
- 210 E Flamingo Rd Unit 317
- 210 E Flamingo Rd Unit 106
- 210 E Flamingo Rd Unit 301
- 210 E Flamingo Rd Unit 332