
Seller's Agent in 2022
Rebecca DeMond
RE/MAX Preferred
(618) 779-3780
23 in this area
484 Total Sales
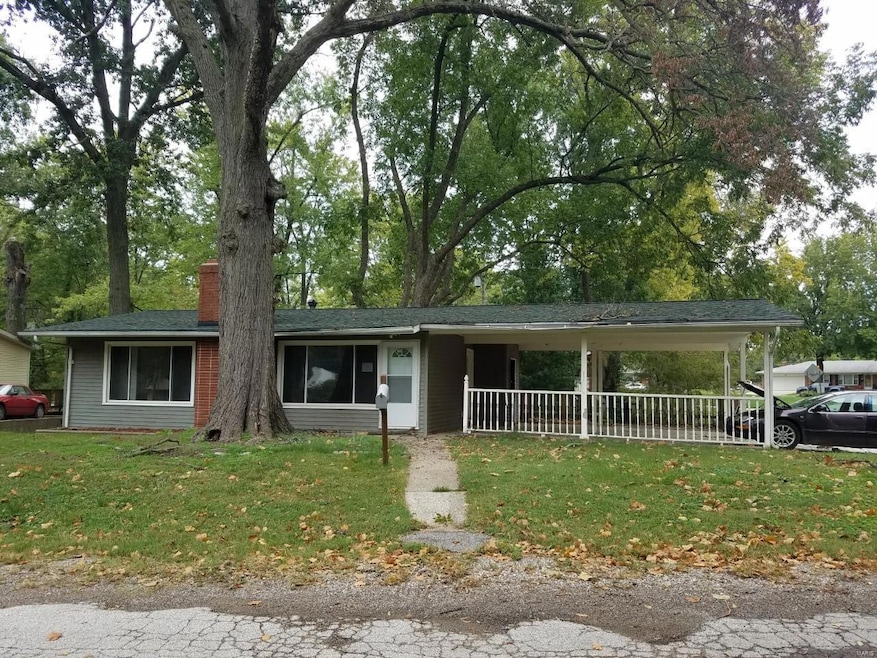
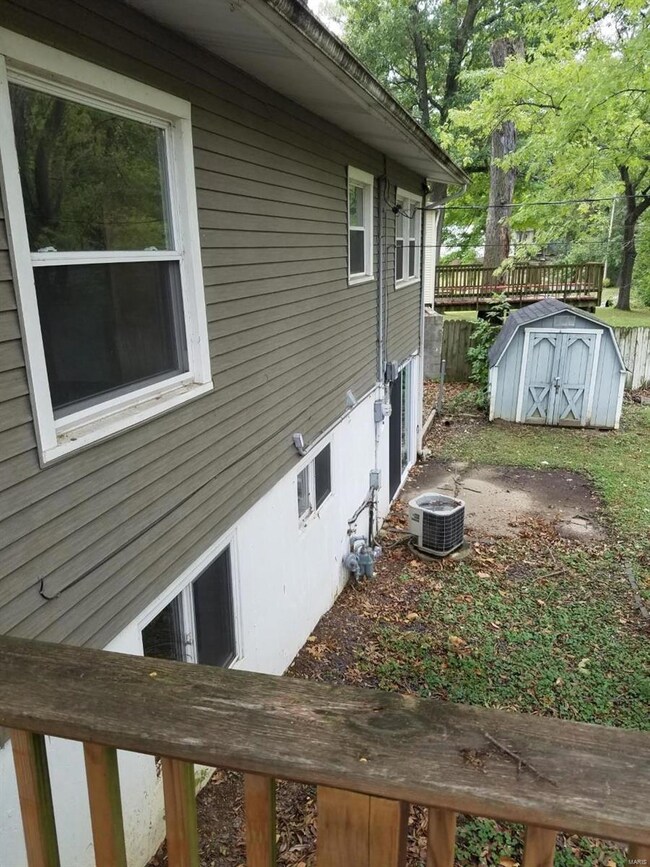
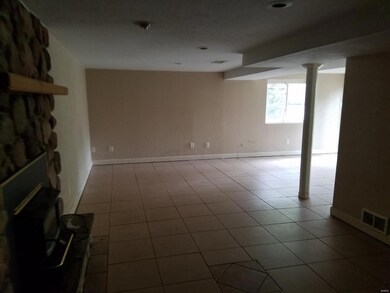
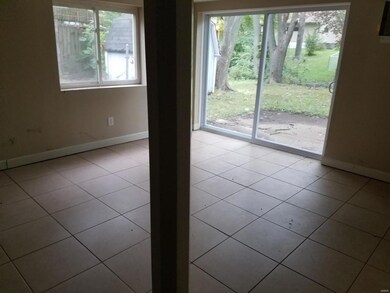
Come enjoy this cozy home. There is plenty of room with the partially finished walk out basement. The home will be a joy to own with the large deck to enjoy the weather and the covered carport spaces for parking or gatherings. Everything is about ease of use here. Come check it out before it's gone! All information, including square footage, should be verified by the buyer. First look initiative effective through 11/22/2018.
Last Agent to Sell the Property
Bill Buckentin
Buck-Lo Real Estate License #475162409 Listed on: 11/02/2018
| Date | Type | Sale Price | Title Company |
|---|---|---|---|
| Quit Claim Deed | -- | None Available | |
| Warranty Deed | $178,000 | Town & Country Title | |
| Warranty Deed | $157,000 | Accent Title Inc | |
| Special Warranty Deed | $83,000 | Attorney | |
| Foreclosure Deed | -- | None Available | |
| Warranty Deed | $137,000 | Pti | |
| Interfamily Deed Transfer | $97,000 | -- |
| Date | Status | Loan Amount | Loan Type |
|---|---|---|---|
| Previous Owner | $157,000 | VA | |
| Previous Owner | $109,600 | Purchase Money Mortgage | |
| Previous Owner | $99,085 | VA |
| Date | Event | Price | Change | Sq Ft Price |
|---|---|---|---|---|
| 09/29/2022 09/29/22 | Sold | $178,000 | -6.3% | $117 / Sq Ft |
| 07/26/2022 07/26/22 | Pending | -- | -- | -- |
| 06/22/2022 06/22/22 | Price Changed | $190,000 | -2.6% | $125 / Sq Ft |
| 06/17/2022 06/17/22 | Price Changed | $195,000 | -2.0% | $129 / Sq Ft |
| 06/06/2022 06/06/22 | For Sale | $199,000 | 0.0% | $131 / Sq Ft |
| 05/30/2022 05/30/22 | Pending | -- | -- | -- |
| 05/23/2022 05/23/22 | Price Changed | $199,000 | -7.4% | $131 / Sq Ft |
| 05/13/2022 05/13/22 | For Sale | $215,000 | +36.9% | $142 / Sq Ft |
| 12/18/2019 12/18/19 | Sold | $157,000 | -1.8% | $87 / Sq Ft |
| 09/18/2019 09/18/19 | For Sale | $159,900 | +93.3% | $88 / Sq Ft |
| 01/31/2019 01/31/19 | Sold | $82,700 | -8.0% | $101 / Sq Ft |
| 12/17/2018 12/17/18 | Pending | -- | -- | -- |
| 11/02/2018 11/02/18 | For Sale | $89,900 | -- | $110 / Sq Ft |
| Year | Tax Paid | Tax Assessment Tax Assessment Total Assessment is a certain percentage of the fair market value that is determined by local assessors to be the total taxable value of land and additions on the property. | Land | Improvement |
|---|---|---|---|---|
| 2024 | $4,027 | $55,246 | $10,457 | $44,789 |
| 2023 | $3,715 | $49,033 | $9,281 | $39,752 |
| 2022 | $3,513 | $45,080 | $8,533 | $36,547 |
| 2021 | $3,026 | $38,115 | $8,559 | $29,556 |
| 2020 | $3,005 | $36,079 | $8,102 | $27,977 |
| 2019 | $2,941 | $36,079 | $8,102 | $27,977 |
| 2018 | $2,865 | $35,032 | $7,867 | $27,165 |
| 2017 | $2,449 | $34,817 | $8,203 | $26,614 |
| 2016 | $2,438 | $34,005 | $8,012 | $25,993 |
| 2014 | $2,241 | $33,611 | $7,919 | $25,692 |
| 2013 | $2,062 | $33,096 | $7,798 | $25,298 |
Seller's Agent in 2022
Rebecca DeMond
RE/MAX Preferred
(618) 779-3780
23 in this area
484 Total Sales
Buyer's Agent in 2022
Caleb Davis
Keller Williams Marquee
(618) 401-8198
36 in this area
841 Total Sales
Seller's Agent in 2019
Scott Shelton
Epique Realty
(618) 792-0489
4 in this area
46 Total Sales
B
Seller's Agent in 2019
Bill Buckentin
Buck-Lo Real Estate
Buyer's Agent in 2019
Reggie Resper
Brick Street Group
(618) 310-0071
51 in this area
233 Total Sales
Source: MARIS MLS
MLS Number: MIS18088090
APN: 04-29.0-104-027
Disclaimer: Certain information contained herein is derived from information provided by parties other than Homes.com. All information provided is deemed reliable, but is not guaranteed to be accurate and should be independently verified.
![]() Based on information submitted to the MLS GRID. All data is obtained from various sources and may not have been verified by broker or MLS GRID. Supplied Open House Information is subject to change without notice. All information should be independently reviewed and verified for accuracy. Properties may or may not be listed by the office/agent presenting the information. Some IDX listings have been excluded from this website.
Based on information submitted to the MLS GRID. All data is obtained from various sources and may not have been verified by broker or MLS GRID. Supplied Open House Information is subject to change without notice. All information should be independently reviewed and verified for accuracy. Properties may or may not be listed by the office/agent presenting the information. Some IDX listings have been excluded from this website.
The Digital Millennium Copyright Act of 1998, 17 U.S.C. § 512 (the “DMCA”) provides recourse for copyright owners who believe that material appearing on the Internet infringes their rights under U.S. copyright law. If you believe in good faith that any content or material made available in connection with our website or services infringes your copyright, you (or your agent) may send us a notice requesting that the content or material be removed, or access to it blocked.
Notices must be sent in writing by email to DMCAnotice@MLSGrid.com.
The DMCA requires that your notice of alleged copyright infringement include the following information:
(1) description of the copyrighted work that is the subject of claimed infringement;
(2) description of the alleged infringing content and information sufficient to permit us to locate the content;
(3) contact information for you, including your address, telephone number and email address;
(4) a statement by you that you have a good faith belief that the content in the manner complained of is not authorized by the copyright owner, or its agent, or by the operation of any law;
(5) a statement by you, signed under penalty of perjury, that the information in the notification is accurate and that you have the authority to enforce the copyrights that are claimed to be infringed; and
(6) a physical or electronic signature of the copyright owner or a person authorized to act on the copyright owner’s behalf. Failure to include all of the above information may result in the delay of the processing of your complaint.