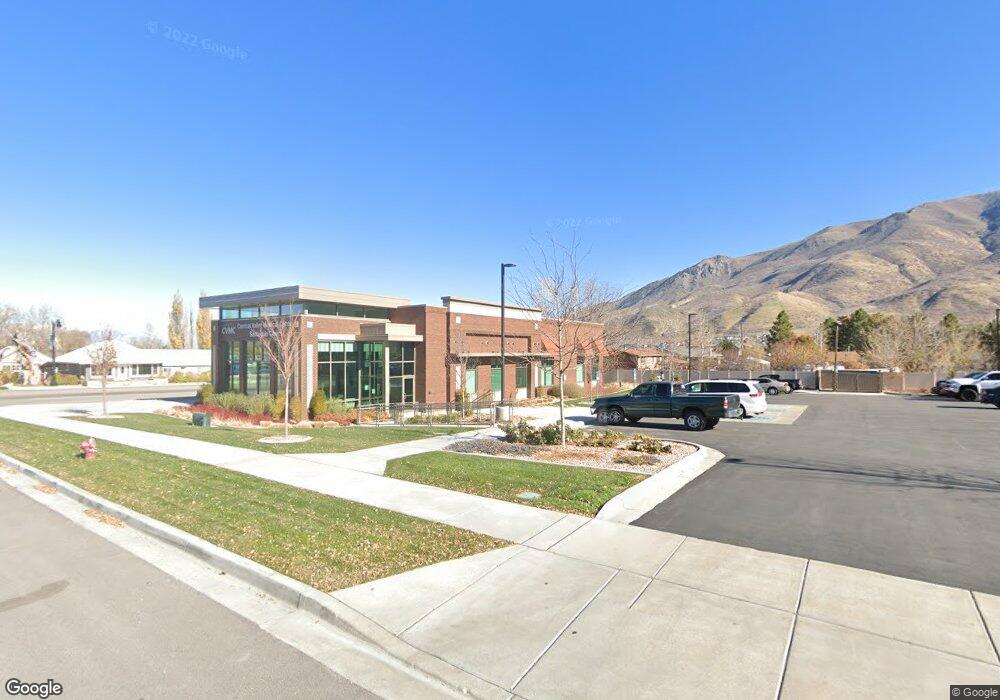
210 E Main St Santaquin, UT 84655
Estimated Value: $197,000
3
Beds
1
Bath
5,101
Sq Ft
$39/Sq Ft
Est. Value
About This Home
This home is located at 210 E Main St, Santaquin, UT 84655 and is currently priced at $197,000, approximately $38 per square foot. 210 E Main St is a home located in Utah County with nearby schools including Santaquin Elementary School, Payson Junior High School, and Mt. Nebo Middle.
Ownership History
Date
Name
Owned For
Owner Type
Purchase Details
Closed on
Apr 3, 2017
Sold by
Neff Lynette H and Hudson Lily G O
Bought by
Neff Lynette H
Current Estimated Value
Purchase Details
Closed on
Mar 27, 2017
Sold by
Neff Lynette H and Hudson Thomas R
Bought by
Central Valley Medical Center
Purchase Details
Closed on
Nov 21, 2005
Sold by
White Gary W
Bought by
Gerald White Properties A F L C
Purchase Details
Closed on
Jul 9, 2004
Sold by
Hudson Rodney and Hudson Lily G O
Bought by
Hudson Roger C and Hudson Carol A
Create a Home Valuation Report for This Property
The Home Valuation Report is an in-depth analysis detailing your home's value as well as a comparison with similar homes in the area
Home Values in the Area
Average Home Value in this Area
Purchase History
| Date | Buyer | Sale Price | Title Company |
|---|---|---|---|
| Neff Lynette H | -- | Jaub Title & Abstract Co | |
| Central Valley Medical Center | -- | Juab Title & Abstract Co | |
| Gerald White Properties A F L C | -- | None Available | |
| Gerald White Properties A F L C | -- | None Available | |
| Hudson Roger C | -- | -- |
Source: Public Records
Tax History
| Year | Tax Paid | Tax Assessment Tax Assessment Total Assessment is a certain percentage of the fair market value that is determined by local assessors to be the total taxable value of land and additions on the property. | Land | Improvement |
|---|---|---|---|---|
| 2025 | $14,746 | $1,438,900 | $264,400 | $1,174,500 |
| 2024 | $14,746 | $1,468,400 | $0 | $0 |
| 2023 | $12,874 | $1,286,100 | $0 | $0 |
| 2022 | $11,068 | $1,140,400 | $214,400 | $926,000 |
| 2021 | $10,639 | $934,600 | $132,900 | $801,700 |
| 2020 | $10,979 | $934,600 | $88,000 | $846,600 |
| 2019 | $10,723 | $933,500 | $78,500 | $855,000 |
| 2018 | $1,006 | $151,800 | $65,500 | $86,300 |
| 2017 | $1,035 | $83,490 | $0 | $0 |
| 2016 | $942 | $74,470 | $0 | $0 |
| 2015 | $886 | $68,640 | $0 | $0 |
| 2014 | $824 | $63,690 | $0 | $0 |
Source: Public Records
Map
Nearby Homes
Your Personal Tour Guide
Ask me questions while you tour the home.