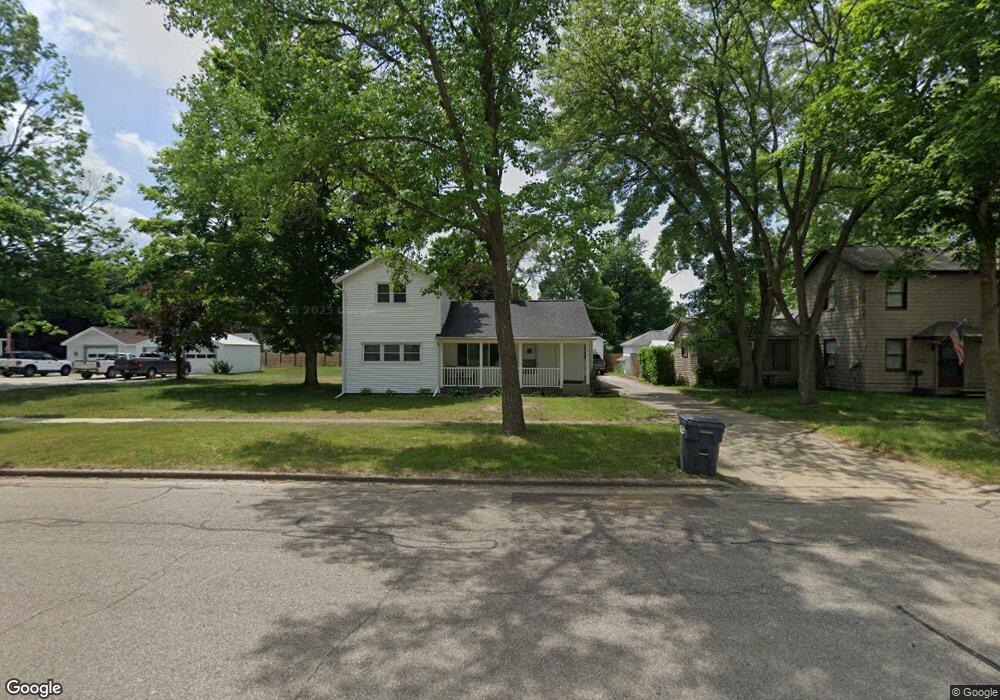
210 E Morrell St Otsego, MI 49078
Estimated Value: $228,000 - $305,000
3
Beds
2
Baths
2,036
Sq Ft
$124/Sq Ft
Est. Value
About This Home
This home is located at 210 E Morrell St, Otsego, MI 49078 and is currently estimated at $252,887, approximately $124 per square foot. 210 E Morrell St is a home located in Allegan County with nearby schools including Otsego High School, Otsego Christian Academy, and St. Margaret School.
Ownership History
Date
Name
Owned For
Owner Type
Purchase Details
Closed on
Dec 4, 2009
Sold by
Beebe James
Bought by
Stewart Richard B
Current Estimated Value
Home Financials for this Owner
Home Financials are based on the most recent Mortgage that was taken out on this home.
Original Mortgage
$96,798
Outstanding Balance
$63,525
Interest Rate
5.02%
Mortgage Type
New Conventional
Estimated Equity
$189,362
Purchase Details
Closed on
Mar 27, 2008
Sold by
Uramkin Douglas J and Uramkin Linda L
Bought by
Beebe James
Create a Home Valuation Report for This Property
The Home Valuation Report is an in-depth analysis detailing your home's value as well as a comparison with similar homes in the area
Home Values in the Area
Average Home Value in this Area
Purchase History
| Date | Buyer | Sale Price | Title Company |
|---|---|---|---|
| Stewart Richard B | $94,900 | Devon Title Agency | |
| Beebe James | $10,000 | Devon Title Agency |
Source: Public Records
Mortgage History
| Date | Status | Borrower | Loan Amount |
|---|---|---|---|
| Open | Stewart Richard B | $96,798 |
Source: Public Records
Tax History
| Year | Tax Paid | Tax Assessment Tax Assessment Total Assessment is a certain percentage of the fair market value that is determined by local assessors to be the total taxable value of land and additions on the property. | Land | Improvement |
|---|---|---|---|---|
| 2025 | $2,398 | $119,000 | $10,000 | $109,000 |
| 2024 | $2,054 | $107,000 | $6,000 | $101,000 |
| 2023 | $2,287 | $94,000 | $5,700 | $88,300 |
| 2022 | $2,054 | $83,300 | $5,700 | $77,600 |
| 2021 | $2,047 | $77,500 | $5,700 | $71,800 |
| 2020 | $2,018 | $78,000 | $5,700 | $72,300 |
| 2019 | $1,963 | $66,200 | $5,700 | $60,500 |
| 2018 | $1,913 | $60,700 | $5,700 | $55,000 |
| 2017 | $0 | $51,000 | $6,200 | $44,800 |
| 2016 | $0 | $47,700 | $4,500 | $43,200 |
| 2015 | -- | $47,700 | $4,500 | $43,200 |
| 2014 | $2,133 | $43,200 | $7,900 | $35,300 |
| 2013 | $2,133 | $41,400 | $6,500 | $34,900 |
Source: Public Records
Map
Nearby Homes
- 324 S Fair St
- 508 S Farmer St
- 1431 Michigan 89
- 229 W Orleans St
- 303 W Franklin St
- 117 N Platt St
- 704 Bayberry Ln
- 216 N Wilmott St
- 365 W Orleans St
- 377 W Orleans St
- 361 W Allegan St
- 241 Helen Ave
- 301 Helen Ave
- 1607 Elm St
- 516 Catherine St
- 909 Barton St
- 1009 Barton St
- 1013 Barton St
- 1006 Goodsell St
- 528 Lincoln Rd
- 411 S Fair St
- 204 E Morrell St
- 222 E Morrell St
- 222 E Morrell St
- 215 E Hammond St
- 211 E Morrell St
- 219 E Hammond St
- 323 S Fair St
- 126 E Morrell St
- 203 E Hammond St
- 230 E Morrell St
- 225 E Hammond St
- 412 S Fair St
- 217 E Morrell St
- 418 S Fair St
- 317 S Fair St
- 116 E Morrell St
- 119 E Hammond St
- 229 E Hammond St
- 223 E Morrell St
Your Personal Tour Guide
Ask me questions while you tour the home.