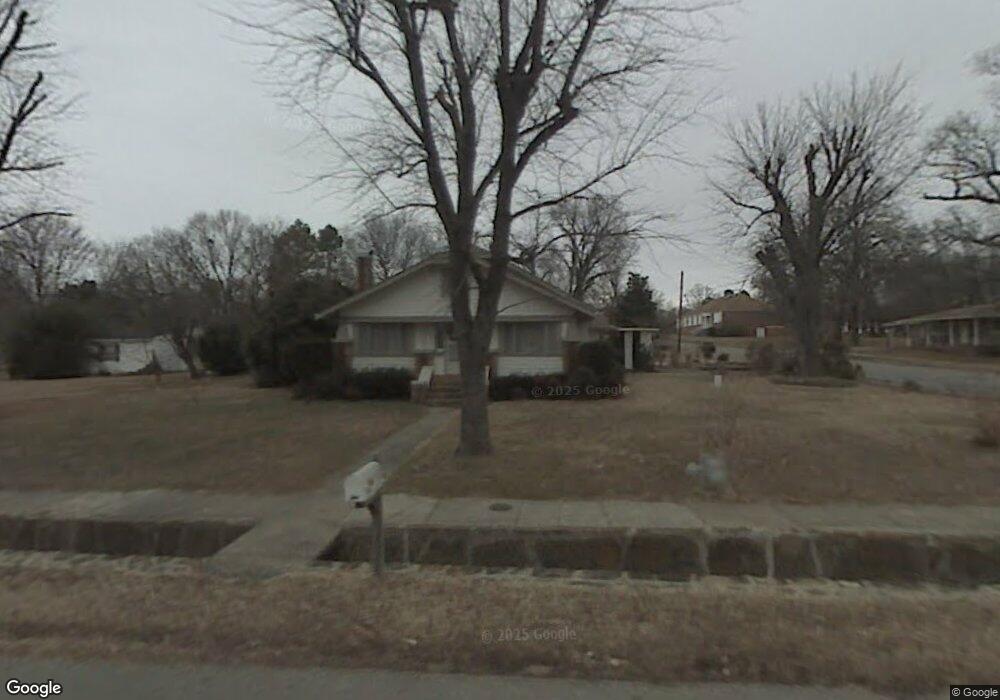
210 E Parks St Prairie Grove, AR 72753
Estimated Value: $227,000 - $329,000
--
Bed
2
Baths
1,900
Sq Ft
$150/Sq Ft
Est. Value
About This Home
This home is located at 210 E Parks St, Prairie Grove, AR 72753 and is currently estimated at $284,626, approximately $149 per square foot. 210 E Parks St is a home located in Washington County with nearby schools including Prairie Grove Elementary School, Prairie Grove Middle School, and Prairie Grove Junior High School.
Ownership History
Date
Name
Owned For
Owner Type
Purchase Details
Closed on
Mar 27, 2007
Sold by
Anderson Scott E and Anderson Sandra D
Bought by
Anderson Scott E and Anderson Sandra D
Current Estimated Value
Home Financials for this Owner
Home Financials are based on the most recent Mortgage that was taken out on this home.
Original Mortgage
$130,400
Outstanding Balance
$78,843
Interest Rate
6.24%
Mortgage Type
New Conventional
Estimated Equity
$205,783
Purchase Details
Closed on
Mar 31, 2005
Sold by
Murr George and Murr Ardith
Bought by
Anderson Scott E and Pillow Sandra D
Home Financials for this Owner
Home Financials are based on the most recent Mortgage that was taken out on this home.
Original Mortgage
$129,600
Interest Rate
8.35%
Mortgage Type
Purchase Money Mortgage
Purchase Details
Closed on
Jan 1, 1985
Bought by
Jones Lorene and P.O. Box 91
Create a Home Valuation Report for This Property
The Home Valuation Report is an in-depth analysis detailing your home's value as well as a comparison with similar homes in the area
Home Values in the Area
Average Home Value in this Area
Purchase History
| Date | Buyer | Sale Price | Title Company |
|---|---|---|---|
| Anderson Scott E | -- | Transcontinental Title Co | |
| Anderson Scott E | $144,000 | -- | |
| Jones Lorene | -- | -- |
Source: Public Records
Mortgage History
| Date | Status | Borrower | Loan Amount |
|---|---|---|---|
| Open | Anderson Scott E | $130,400 | |
| Closed | Anderson Scott E | $129,600 |
Source: Public Records
Tax History Compared to Growth
Tax History
| Year | Tax Paid | Tax Assessment Tax Assessment Total Assessment is a certain percentage of the fair market value that is determined by local assessors to be the total taxable value of land and additions on the property. | Land | Improvement |
|---|---|---|---|---|
| 2025 | $836 | $39,140 | $7,700 | $31,440 |
| 2024 | $895 | $39,140 | $7,700 | $31,440 |
| 2023 | $958 | $39,140 | $7,700 | $31,440 |
| 2022 | $942 | $28,190 | $3,850 | $24,340 |
| 2021 | $885 | $28,190 | $3,850 | $24,340 |
| 2020 | $823 | $28,190 | $3,850 | $24,340 |
| 2019 | $779 | $21,210 | $6,000 | $15,210 |
| 2018 | $793 | $21,210 | $6,000 | $15,210 |
| 2017 | $793 | $21,210 | $6,000 | $15,210 |
| 2016 | $793 | $21,210 | $6,000 | $15,210 |
| 2015 | $793 | $21,210 | $6,000 | $15,210 |
| 2014 | $732 | $20,070 | $6,000 | $14,070 |
Source: Public Records
Map
Nearby Homes
- 208 N Neal St
- TBD Kate Smith St
- 4.66 +/- AC Tract 5 Hwy 62 & S Mock St
- 204 Armstrong St
- 303 E Center St
- 106 S Ozark St
- Lot 2 Holmes St
- 201 E Cleveland St
- 107 S Ozark St
- 201 E Douglas St
- 0 Douglas St Unit 1293623
- 606 1/2 E Buchanan St
- 680 Marcella St
- 901 E Buchanan St
- 881 E Buchanan St
- 710 Marcella St
- 224 Stapleton Dr
- 608 Catlett St
- 631 Kendra St
- 641 Marcella St
- 304 E Parks St
- 200 E Parks St
- 209 N Neal St
- 211 E Parks St Unit A
- 211 E Parks St Unit A & B
- 00 S Neal St
- 146 N Neal St
- 203 E Parks St
- 209 Rogers St
- 149 N Neal St
- 212 N Neal St
- 306 E Parks St
- 109 E Parks St
- 109 W Parks St
- 108 E Parks St
- 213 Rogers St
- 145 N Neal St
- 106 E Parks St
- 107 E Parks St
- 305 E Bush St