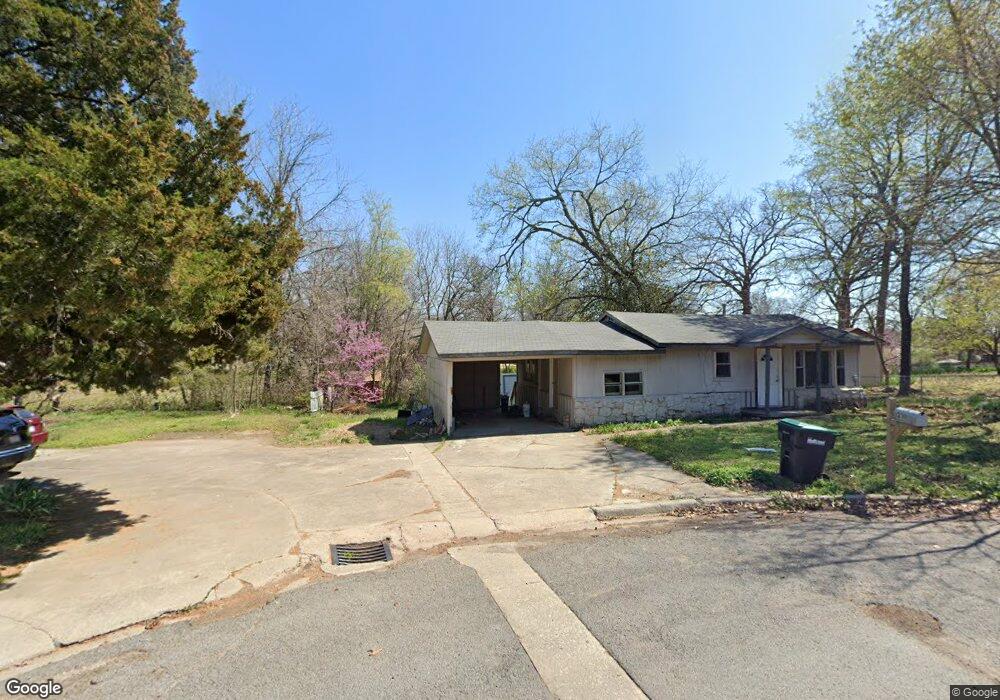
210 E Seneca St Tahlequah, OK 74464
Estimated Value: $52,000 - $129,000
3
Beds
1
Bath
836
Sq Ft
$106/Sq Ft
Est. Value
About This Home
This home is located at 210 E Seneca St, Tahlequah, OK 74464 and is currently estimated at $88,657, approximately $106 per square foot. 210 E Seneca St is a home located in Cherokee County with nearby schools including Cherokee Elementary School, Greenwood Elementary School, and Tahlequah Middle School.
Ownership History
Date
Name
Owned For
Owner Type
Purchase Details
Closed on
Jul 25, 2024
Sold by
Charles E Carroll Revocable Living Trust
Bought by
Worthington William and Worthington Wendi
Current Estimated Value
Purchase Details
Closed on
Dec 17, 2020
Sold by
Betty William L
Bought by
Charles E Carroll Revocable Living Trust and Mildred E Carroll Revocable Living Trust
Purchase Details
Closed on
Jun 15, 2012
Sold by
Kesner Properties Llc
Bought by
Berry William I
Home Financials for this Owner
Home Financials are based on the most recent Mortgage that was taken out on this home.
Original Mortgage
$39,772
Interest Rate
3.8%
Mortgage Type
Future Advance Clause Open End Mortgage
Purchase Details
Closed on
Apr 26, 2006
Sold by
Choate Walt and Choate Lois E
Bought by
Kesner Tony L and Kesner Lynn L
Purchase Details
Closed on
Oct 20, 1994
Sold by
Troy and Joann Bradley
Bought by
Lois E Choate
Create a Home Valuation Report for This Property
The Home Valuation Report is an in-depth analysis detailing your home's value as well as a comparison with similar homes in the area
Home Values in the Area
Average Home Value in this Area
Purchase History
| Date | Buyer | Sale Price | Title Company |
|---|---|---|---|
| Worthington William | $55,000 | Green Country Abstract & Title | |
| Charles E Carroll Revocable Living Trust | $40,000 | Fidelity National Ttl Ins Co | |
| Berry William I | $35,000 | None Available | |
| Kesner Tony L | $39,500 | Tahilsquah Absfract Closing | |
| Lois E Choate | $26,000 | -- |
Source: Public Records
Mortgage History
| Date | Status | Borrower | Loan Amount |
|---|---|---|---|
| Previous Owner | Berry William I | $39,772 |
Source: Public Records
Tax History Compared to Growth
Tax History
| Year | Tax Paid | Tax Assessment Tax Assessment Total Assessment is a certain percentage of the fair market value that is determined by local assessors to be the total taxable value of land and additions on the property. | Land | Improvement |
|---|---|---|---|---|
| 2025 | $394 | $4,067 | $526 | $3,541 |
| 2024 | $394 | $4,156 | $504 | $3,652 |
| 2023 | $394 | $3,958 | $450 | $3,508 |
| 2022 | $367 | $3,958 | $450 | $3,508 |
| 2021 | $369 | $3,958 | $450 | $3,508 |
| 2020 | $447 | $4,717 | $450 | $4,267 |
| 2019 | $422 | $4,492 | $429 | $4,063 |
| 2018 | $407 | $4,278 | $481 | $3,797 |
| 2017 | $387 | $4,075 | $458 | $3,617 |
| 2016 | $370 | $3,880 | $436 | $3,444 |
| 2015 | $331 | $3,696 | $452 | $3,244 |
| 2014 | $331 | $3,520 | $330 | $3,190 |
Source: Public Records
Map
Nearby Homes
- 425 E Seneca St
- 802 E Seneca St
- 112 W Allen Rd
- 2020 N Everly Dr
- 2021 N Everly Dr
- 2000 N Everly Dr
- 1930 N Everly Dr
- 2010 N Everly Dr
- 2030 N Everly Dr
- 2031 N Everly Dr
- 2040 N Everly Dr
- 707 Victor St
- 1408 Trimble Ave
- 717 N Oklahoma Ave
- 920 Francis Ave
- 1406 Skipper Ave
- 710 Victor St
- 310 York St
- 916 Coy Ave
- 402 Minor St
- 303 E Seneca St
- 209 E Seneca St
- 211 E Seneca St
- 1103 Mike Ave
- 1105 Mike Ave
- 1008 Jackson Ave
- 202 E Seneca St
- 1006 Jackson Ave
- 204 Jamestown St
- 208 Jamestown St
- 1009 Mike Ave
- 202 Jamestown St
- 207 E Seneca St
- 203 E Seneca St
- 205 E Seneca St
- 1100 Mike Ave
- 1200 Jamestown Dr
- 304 Jamestown St
- 1202 Jackson Ave