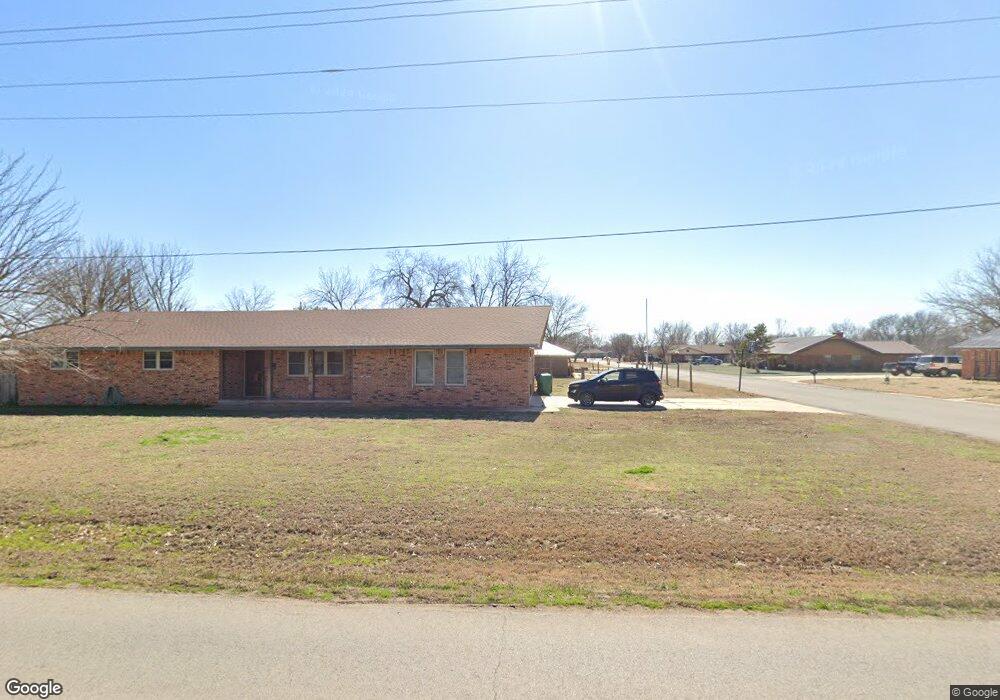
210 E South Boundary St Walters, OK 73572
Estimated Value: $156,000 - $169,000
5
Beds
2
Baths
2,400
Sq Ft
$68/Sq Ft
Est. Value
About This Home
This home is located at 210 E South Boundary St, Walters, OK 73572 and is currently estimated at $163,160, approximately $67 per square foot. 210 E South Boundary St is a home located in Cotton County with nearby schools including Walters Elementary School, Walters Middle School, and Walters High School.
Ownership History
Date
Name
Owned For
Owner Type
Purchase Details
Closed on
Jul 21, 2021
Sold by
Scott Sean W and Scott Tanya
Bought by
Bussinger Jay T and Bussinger Aadel D
Current Estimated Value
Home Financials for this Owner
Home Financials are based on the most recent Mortgage that was taken out on this home.
Original Mortgage
$125,000
Outstanding Balance
$113,522
Interest Rate
2.96%
Mortgage Type
VA
Estimated Equity
$49,638
Purchase Details
Closed on
Jan 31, 2005
Sold by
Crow Jack and Crow Wanda
Bought by
Scott Sean W
Home Financials for this Owner
Home Financials are based on the most recent Mortgage that was taken out on this home.
Original Mortgage
$118,146
Interest Rate
5.8%
Mortgage Type
FHA
Purchase Details
Closed on
Apr 24, 1992
Sold by
Lloyd and Rachel Dromgoole
Bought by
Jack and Wanda Crow
Create a Home Valuation Report for This Property
The Home Valuation Report is an in-depth analysis detailing your home's value as well as a comparison with similar homes in the area
Home Values in the Area
Average Home Value in this Area
Purchase History
| Date | Buyer | Sale Price | Title Company |
|---|---|---|---|
| Bussinger Jay T | $125,000 | Sovereign Title Services | |
| Scott Sean W | $120,000 | Community Escrow & Title Co | |
| Jack | $75,000 | -- |
Source: Public Records
Mortgage History
| Date | Status | Borrower | Loan Amount |
|---|---|---|---|
| Open | Bussinger Jay T | $125,000 | |
| Previous Owner | Scott Sean W | $118,146 |
Source: Public Records
Tax History Compared to Growth
Tax History
| Year | Tax Paid | Tax Assessment Tax Assessment Total Assessment is a certain percentage of the fair market value that is determined by local assessors to be the total taxable value of land and additions on the property. | Land | Improvement |
|---|---|---|---|---|
| 2024 | -- | $13,685 | $1,150 | $12,535 |
| 2023 | $0 | $13,287 | $1,150 | $12,137 |
| 2022 | $851 | $14,375 | $1,150 | $13,225 |
| 2021 | $851 | $11,463 | $1,150 | $10,313 |
| 2020 | $867 | $11,675 | $1,150 | $10,525 |
| 2019 | $1,003 | $12,102 | $1,150 | $10,952 |
| 2018 | $1,009 | $12,138 | $1,150 | $10,988 |
| 2017 | $1,008 | $12,094 | $1,150 | $10,944 |
| 2016 | $950 | $12,392 | $1,150 | $11,242 |
| 2015 | $954 | $12,376 | $1,150 | $11,226 |
| 2014 | $1,015 | $12,015 | $1,150 | $10,865 |
Source: Public Records
Map
Nearby Homes
- 502 E Wyoming St
- 227 E Ohio St
- 121 E Texas St
- 132 Lions Cove
- 0 W Indiana Ave
- 317 E Nebraska St
- 103 Thurman Dr
- 308 Willow Creek Dr
- 603 E California Ave
- 220 E Kansas St
- 230 W Colorado St
- 602 Tramel Cir
- 321 N 3rd St
- 119 W Iowa St
- 000 N 2620 Rd
- 130 Stardust Cir
- 180000 N 2600 Rd
- 258418 E 1810 Rd
- 187677 N 2590 Rd
- N2600
- 1103 Heather Dr
- 1100 Holly St
- 1104 Holly St
- 1102 Heather Dr
- 1018 S 2nd St
- 1105 Heather Dr
- 231 E South Boundary St
- 1104 Heather Dr
- 1106 Holly St
- 307 E South Boundary St
- 207 E South Boundary St
- 1101 Holly St
- 327 E South Boundary St
- 1103 Holly St
- 1108 Holly St
- 202 Heather Place
- 1105 Holly St
- 203 E South Boundary St
- 230 E Wyoming St
- 206 Heather Place