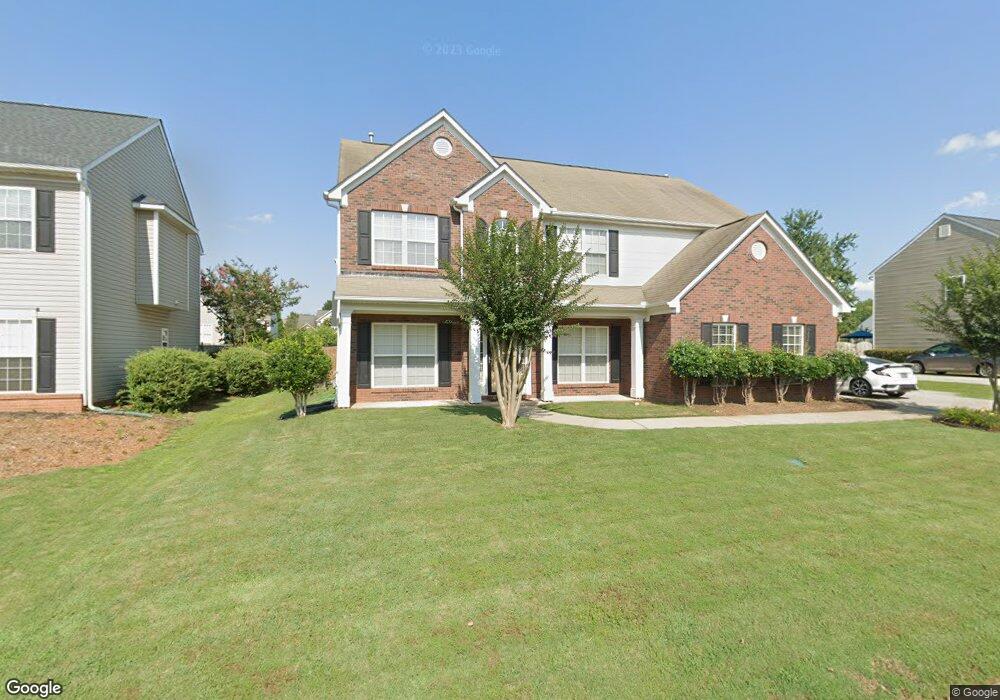
210 Elstar Loop Rd Simpsonville, SC 29681
Estimated Value: $416,000 - $448,000
4
Beds
3
Baths
2,624
Sq Ft
$165/Sq Ft
Est. Value
About This Home
This home is located at 210 Elstar Loop Rd, Simpsonville, SC 29681 and is currently estimated at $433,235, approximately $165 per square foot. 210 Elstar Loop Rd is a home located in Greenville County with nearby schools including Bell's Crossing Elementary School, Riverside Middle School, and Mauldin High School.
Ownership History
Date
Name
Owned For
Owner Type
Purchase Details
Closed on
Jun 24, 2022
Sold by
210 Elstar Loop Llc
Bought by
Richmond Constance
Current Estimated Value
Home Financials for this Owner
Home Financials are based on the most recent Mortgage that was taken out on this home.
Original Mortgage
$315,000
Outstanding Balance
$297,947
Interest Rate
5.25%
Mortgage Type
New Conventional
Estimated Equity
$135,288
Purchase Details
Closed on
Nov 29, 2017
Sold by
Kilcoyne Christopiter D
Bought by
210 Elstar Loop Llc
Purchase Details
Closed on
Jan 13, 2012
Sold by
Kilcoyne Michelle C
Bought by
Kilcoyne Christopher D
Home Financials for this Owner
Home Financials are based on the most recent Mortgage that was taken out on this home.
Original Mortgage
$174,000
Interest Rate
4%
Mortgage Type
New Conventional
Create a Home Valuation Report for This Property
The Home Valuation Report is an in-depth analysis detailing your home's value as well as a comparison with similar homes in the area
Home Values in the Area
Average Home Value in this Area
Purchase History
| Date | Buyer | Sale Price | Title Company |
|---|---|---|---|
| Richmond Constance | $350,000 | None Listed On Document | |
| 210 Elstar Loop Llc | -- | None Available | |
| Kilcoyne Christopher D | -- | -- |
Source: Public Records
Mortgage History
| Date | Status | Borrower | Loan Amount |
|---|---|---|---|
| Open | Richmond Constance | $315,000 | |
| Previous Owner | Kilcoyne Christopher D | $174,000 |
Source: Public Records
Tax History
| Year | Tax Paid | Tax Assessment Tax Assessment Total Assessment is a certain percentage of the fair market value that is determined by local assessors to be the total taxable value of land and additions on the property. | Land | Improvement |
|---|---|---|---|---|
| 2025 | $2,195 | $15,930 | $2,780 | $13,150 |
| 2024 | $2,195 | $13,850 | $1,600 | $12,250 |
| 2023 | $2,093 | $13,850 | $1,600 | $12,250 |
| 2022 | $4,299 | $14,650 | $2,400 | $12,250 |
| 2021 | $4,199 | $14,650 | $2,400 | $12,250 |
| 2020 | $3,899 | $12,850 | $1,800 | $11,050 |
| 2019 | $3,867 | $12,850 | $1,800 | $11,050 |
| 2018 | $3,890 | $12,850 | $1,800 | $11,050 |
| 2017 | $3,824 | $12,850 | $1,800 | $11,050 |
| 2016 | $3,715 | $214,130 | $30,000 | $184,130 |
| 2015 | $3,714 | $214,130 | $30,000 | $184,130 |
| 2014 | $3,750 | $218,740 | $32,000 | $186,740 |
Source: Public Records
Map
Nearby Homes
- 2 Petal Ct
- 103 Bedfordton Ct
- 205 Allendale Abbey Ln
- 4 Kersey Gale Ct
- 100 Golden Leaf Ln
- 14 S Penobscot Ct
- 607 Greening Dr
- 3 S Penobscot Ct
- 106 Honey Crisp Way
- 324 Karsten Creek Dr
- 410 Revis Creek Ct
- 309 Valhalla Ln
- 306 Revis Creek Ct
- 2 Ivory Arch Ct
- 317 Tanoak Ct
- 315 Tanoak Ct
- 2 Chestnut Pond Ln
- Lot 8 Nivie Ln
- 40 Nivie Ln
- Lot 5 Nivie Ln
- 212 Elstar Loop Rd
- 208 Elstar Loop Rd
- 7 Braeburn Dr
- 5 Braeburn Dr
- 9 Braeburn Dr
- 219 Elstar Loop Rd
- 217 Elstar Loop Rd
- 214 Elstar Loop Rd
- 206 Elstar Loop Rd
- 221 Elstar Loop Rd
- 3 Braeburn Dr
- 11 Braeburn Dr
- 215 Elstar Loop Rd
- 223 Elstar Loop Rd
- 204 Elstar Loop Rd
- 6 Braeburn Dr
- 216 Elstar Loop Rd
- 8 Braeburn Dr
- 13 Braeburn Dr
- 213 Elstar Loop Rd
Your Personal Tour Guide
Ask me questions while you tour the home.