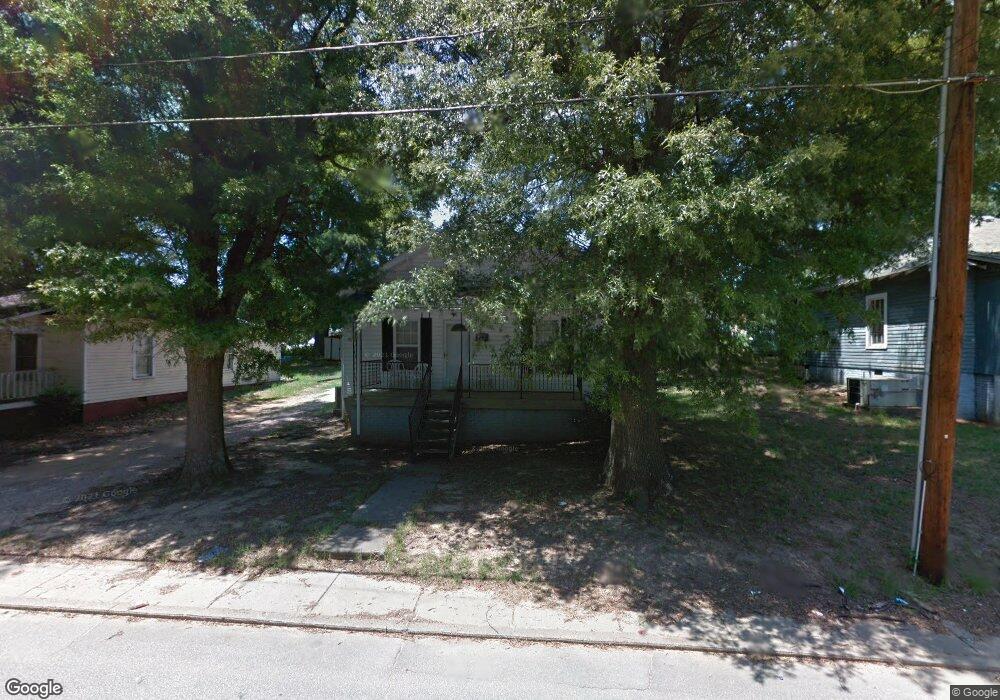
210 Flowe Ave Kannapolis, NC 28083
Estimated Value: $176,000 - $225,000
2
Beds
1
Bath
970
Sq Ft
$203/Sq Ft
Est. Value
About This Home
This home is located at 210 Flowe Ave, Kannapolis, NC 28083 and is currently estimated at $196,460, approximately $202 per square foot. 210 Flowe Ave is a home located in Cabarrus County with nearby schools including North Kannapolis Elementary School, Kannapolis Middle, and A.L. Brown High School.
Ownership History
Date
Name
Owned For
Owner Type
Purchase Details
Closed on
May 28, 2024
Sold by
Robinson Tamika
Bought by
Robinson Tamika
Current Estimated Value
Purchase Details
Closed on
May 14, 2015
Sold by
Robinson David E
Bought by
Robinson David E and Robinson Tamika
Home Financials for this Owner
Home Financials are based on the most recent Mortgage that was taken out on this home.
Original Mortgage
$36,190
Interest Rate
3.04%
Mortgage Type
New Conventional
Purchase Details
Closed on
Mar 14, 2002
Sold by
Robinson Lisa Poteat
Bought by
Robinson David E
Home Financials for this Owner
Home Financials are based on the most recent Mortgage that was taken out on this home.
Original Mortgage
$42,709
Interest Rate
6.86%
Purchase Details
Closed on
Aug 1, 1993
Bought by
Robinson David E
Purchase Details
Closed on
Jan 1, 1986
Create a Home Valuation Report for This Property
The Home Valuation Report is an in-depth analysis detailing your home's value as well as a comparison with similar homes in the area
Home Values in the Area
Average Home Value in this Area
Purchase History
| Date | Buyer | Sale Price | Title Company |
|---|---|---|---|
| Robinson Tamika | -- | None Listed On Document | |
| Robinson David E | -- | Old Republic Title | |
| Robinson David E | -- | -- | |
| Robinson David E | $25,000 | -- | |
| -- | $14,000 | -- |
Source: Public Records
Mortgage History
| Date | Status | Borrower | Loan Amount |
|---|---|---|---|
| Previous Owner | Robinson David E | $36,190 | |
| Previous Owner | Robinson David E | $42,709 |
Source: Public Records
Tax History
| Year | Tax Paid | Tax Assessment Tax Assessment Total Assessment is a certain percentage of the fair market value that is determined by local assessors to be the total taxable value of land and additions on the property. | Land | Improvement |
|---|---|---|---|---|
| 2025 | $1,875 | $165,110 | $48,000 | $117,110 |
| 2024 | $1,875 | $165,110 | $48,000 | $117,110 |
| 2023 | $1,298 | $94,720 | $30,000 | $64,720 |
| 2022 | $1,298 | $94,720 | $30,000 | $64,720 |
| 2021 | $1,298 | $94,720 | $30,000 | $64,720 |
| 2020 | $1,298 | $94,720 | $30,000 | $64,720 |
| 2019 | $874 | $63,790 | $13,600 | $50,190 |
| 2018 | $861 | $63,790 | $13,600 | $50,190 |
| 2017 | $848 | $63,790 | $13,600 | $50,190 |
| 2016 | $848 | $71,960 | $22,400 | $49,560 |
| 2015 | $907 | $71,960 | $22,400 | $49,560 |
| 2014 | $907 | $71,960 | $22,400 | $49,560 |
Source: Public Records
Map
Nearby Homes
- 306 York Ave
- 600 Foster St
- 351 Old Centergrove Rd
- 609 Huron St
- 315 S Rose Ave
- 535 Martin Luther King Junior Ave
- 541 Martin Luther King Junior Ave
- 661 Wilson St
- 705 Gem St
- 123 James St
- 704 Gem St Unit 17
- 200 Martin Luther King Junior Ave
- 143 Johndy Ave
- 5941 Mantle Way
- 315 Pineview St
- 707 Oakshade Ave
- 6351 Lopez Ct
- 815 Desoto Ave
- 3150 Baines Ct
- 604 Fairview St
Your Personal Tour Guide
Ask me questions while you tour the home.