Estimated Value: $152,000 - $181,000
3
Beds
2
Baths
1,260
Sq Ft
$133/Sq Ft
Est. Value
About This Home
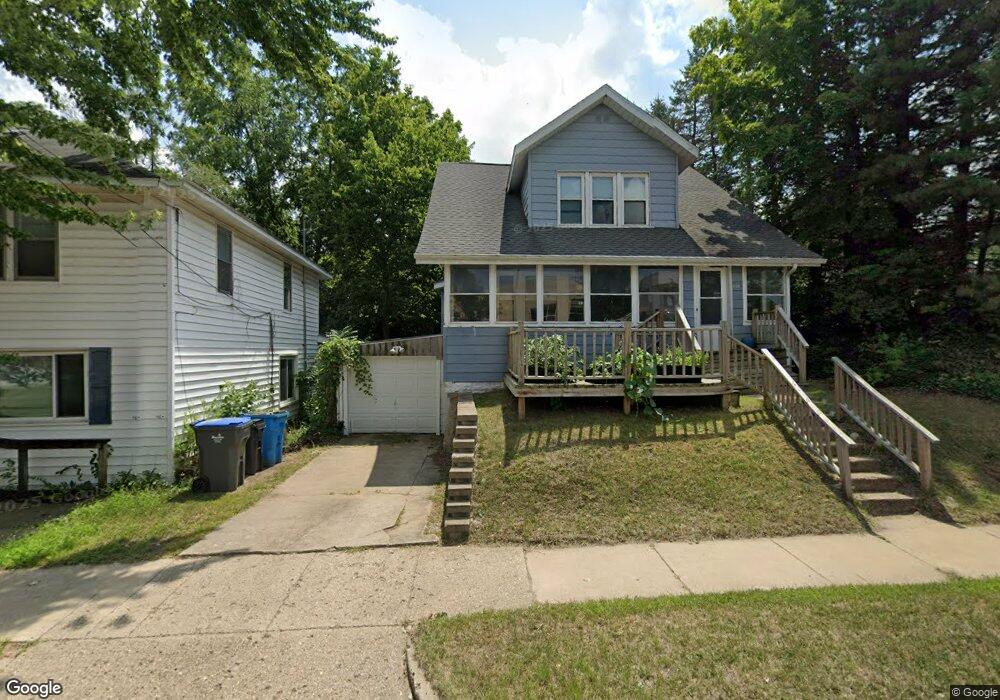
This home is located at 210 Grant St, Niles, MI 49120 and is currently estimated at $167,067, approximately $132 per square foot. 210 Grant St is a home located in Berrien County with nearby schools including Ballard Elementary School, Oak Manor Sixth Grade Center, and Ring Lardner Middle School.
Ownership History
Date
Name
Owned For
Owner Type
Purchase Details
Closed on
Feb 23, 2024
Sold by
Paul T Kelleher T and Paul Claudia M
Bought by
Fournier Denise N
Current Estimated Value
Home Financials for this Owner
Home Financials are based on the most recent Mortgage that was taken out on this home.
Original Mortgage
$117,000
Outstanding Balance
$114,952
Interest Rate
6.66%
Mortgage Type
New Conventional
Estimated Equity
$52,115
Purchase Details
Closed on
Feb 21, 2024
Sold by
Claudia M Ruppel Trust and Kelleher Paul T
Bought by
Fournier Denise N
Home Financials for this Owner
Home Financials are based on the most recent Mortgage that was taken out on this home.
Original Mortgage
$117,000
Outstanding Balance
$114,952
Interest Rate
6.66%
Mortgage Type
New Conventional
Estimated Equity
$52,115
Purchase Details
Closed on
Jan 14, 2021
Sold by
Vandyke Linda L
Bought by
Kelleher Claudia M and Claudia M Ruppel Trust
Purchase Details
Closed on
Jan 8, 1992
Create a Home Valuation Report for This Property
The Home Valuation Report is an in-depth analysis detailing your home's value as well as a comparison with similar homes in the area
Home Values in the Area
Average Home Value in this Area
Purchase History
| Date | Buyer | Sale Price | Title Company |
|---|---|---|---|
| Fournier Denise N | $152,000 | First American Title | |
| Fournier Denise N | $152,000 | First American Title | |
| Kelleher Claudia M | $100,500 | First American Title | |
| -- | $27,800 | -- |
Source: Public Records
Mortgage History
| Date | Status | Borrower | Loan Amount |
|---|---|---|---|
| Open | Fournier Denise N | $117,000 | |
| Closed | Fournier Denise N | $117,000 |
Source: Public Records
Tax History Compared to Growth
Tax History
| Year | Tax Paid | Tax Assessment Tax Assessment Total Assessment is a certain percentage of the fair market value that is determined by local assessors to be the total taxable value of land and additions on the property. | Land | Improvement |
|---|---|---|---|---|
| 2025 | $2,229 | $65,200 | $0 | $0 |
| 2024 | $1,766 | $60,400 | $0 | $0 |
| 2023 | $1,693 | $56,500 | $0 | $0 |
| 2022 | $1,655 | $55,200 | $0 | $0 |
| 2021 | $1,192 | $48,100 | $3,300 | $44,800 |
| 2020 | $1,179 | $41,700 | $0 | $0 |
| 2019 | $1,164 | $34,000 | $1,500 | $32,500 |
| 2018 | $1,126 | $34,000 | $0 | $0 |
| 2017 | $1,107 | $29,000 | $0 | $0 |
| 2016 | $1,208 | $32,100 | $0 | $0 |
| 2015 | $1,256 | $33,800 | $0 | $0 |
| 2014 | $981 | $33,700 | $0 | $0 |
Source: Public Records
Map
Nearby Homes
- 210 Grant St
- 206 Grant St
- 208 Grant St
- 18 Market St
- 21 S Saint Joseph Ave
- 22 Market St
- 21 S Street Joseph Ave
- 16 S St Joseph Ave
- 22 S St Joseph Ave
- 210 Emmons St
- 22 S Street Joseph Ave
- 119 Emmons St
- 104 Market St
- 103 S St Joseph Ave
- 103 S Street Joseph Ave
- 103 S Saint Joseph Ave
- 22 S Saint Joseph Ave
- 107 S Saint Joseph Ave
- 107 S Street Joseph Ave
- 110 Market St