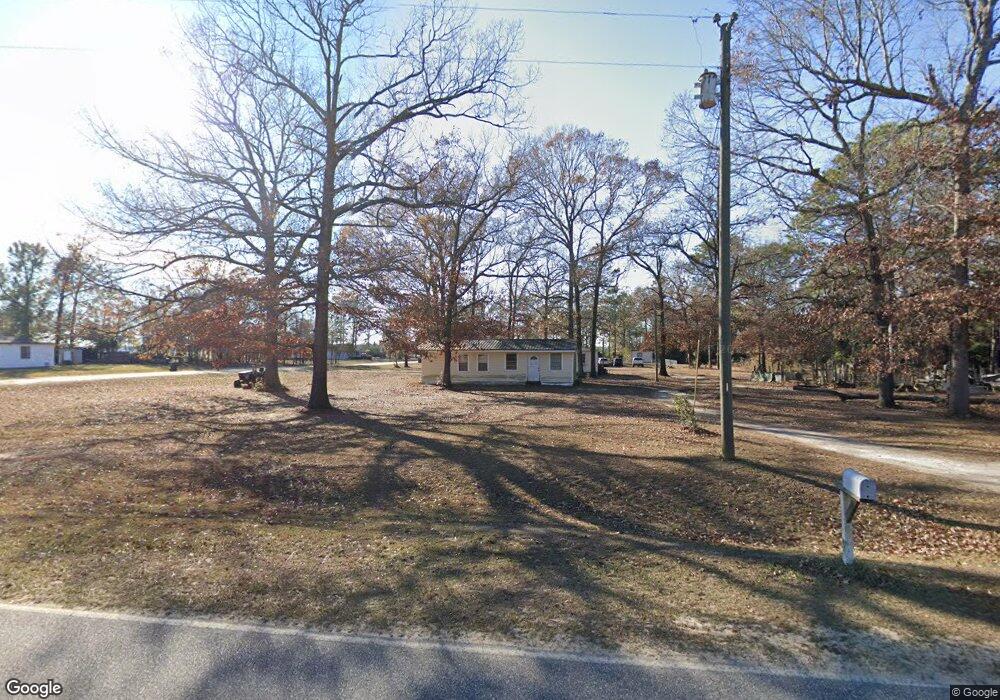
210 Hales Landing Rd Bainbridge, GA 39817
Estimated Value: $101,000 - $153,000
--
Bed
1
Bath
1,320
Sq Ft
$90/Sq Ft
Est. Value
About This Home
This home is located at 210 Hales Landing Rd, Bainbridge, GA 39817 and is currently estimated at $118,982, approximately $90 per square foot. 210 Hales Landing Rd is a home located in Decatur County with nearby schools including Bainbridge High School.
Ownership History
Date
Name
Owned For
Owner Type
Purchase Details
Closed on
Jun 26, 2015
Sold by
Carr Douglas
Bought by
Pons Angel L Rosa and Rosario Migdalia M
Current Estimated Value
Home Financials for this Owner
Home Financials are based on the most recent Mortgage that was taken out on this home.
Original Mortgage
$47,700
Interest Rate
3.93%
Mortgage Type
New Conventional
Purchase Details
Closed on
Dec 1, 2014
Sold by
Carr Randall Craig
Bought by
Carr Douglas
Home Financials for this Owner
Home Financials are based on the most recent Mortgage that was taken out on this home.
Original Mortgage
$40,311
Interest Rate
4.02%
Mortgage Type
New Conventional
Purchase Details
Closed on
Dec 7, 2007
Sold by
Forbes Clarence A
Bought by
Carr Randall C
Home Financials for this Owner
Home Financials are based on the most recent Mortgage that was taken out on this home.
Original Mortgage
$45,598
Interest Rate
6.22%
Mortgage Type
New Conventional
Create a Home Valuation Report for This Property
The Home Valuation Report is an in-depth analysis detailing your home's value as well as a comparison with similar homes in the area
Home Values in the Area
Average Home Value in this Area
Purchase History
| Date | Buyer | Sale Price | Title Company |
|---|---|---|---|
| Pons Angel L Rosa | $53,000 | -- | |
| Carr Douglas | $38,913 | -- | |
| Carr Randall C | $45,000 | -- |
Source: Public Records
Mortgage History
| Date | Status | Borrower | Loan Amount |
|---|---|---|---|
| Closed | Pons Angel L Rosa | $47,700 | |
| Previous Owner | Carr Douglas | $40,311 | |
| Previous Owner | Carr Randall C | $45,598 |
Source: Public Records
Tax History Compared to Growth
Tax History
| Year | Tax Paid | Tax Assessment Tax Assessment Total Assessment is a certain percentage of the fair market value that is determined by local assessors to be the total taxable value of land and additions on the property. | Land | Improvement |
|---|---|---|---|---|
| 2024 | $914 | $32,336 | $10,120 | $22,216 |
| 2023 | $490 | $32,336 | $10,120 | $22,216 |
| 2022 | $730 | $27,102 | $7,100 | $20,002 |
| 2021 | $701 | $25,632 | $6,480 | $19,152 |
| 2020 | $656 | $23,012 | $6,480 | $16,532 |
| 2019 | $654 | $22,172 | $6,480 | $15,692 |
| 2018 | $494 | $17,435 | $6,480 | $10,955 |
| 2017 | $547 | $17,435 | $6,480 | $10,955 |
| 2016 | $547 | $17,448 | $6,493 | $10,955 |
| 2015 | $491 | $17,448 | $6,493 | $10,955 |
Source: Public Records
Map
Nearby Homes
- 000 Georgia 253
- 433 Bennett Rentz Rd
- 112 River Oaks Dr
- TBD LOT 99 & 10 Seminole Ridge S D
- 214 Riverchase Dr
- 206 Riverchase Dr
- TBD LOT 98 Seminole Ridge S D
- TBD LOT 2 Seminole Ridge S D
- TBD LOT 29 Seminole Ridge S D
- TBD LOT 77, 78 Seminole Ridge S D
- Lot 13 A Mountain View Way Unit 13 A
- Lot 12 A Mountain View Way Unit 12
- 145 Robin Ln
- 0 Faceville Hwy
- 4334 Faceville Hwy
- 2400 Airport Rd Unit 6
- 2400 Airport Rd
- 1000 Faceville Hwy
- 125 John Sam Rd
- 1101 Faceville Hwy
- Lot 18 Hales Landing Rd
- 201 Hales Landing Rd
- 200 Hales Landing Rd
- 112 Merle Carr Dr
- 114 Dolly Dr
- 110 Dolly Dr
- 121 Dolly Dr
- 0 Hales Landing Rd
- 113 W Judith Dr
- 122 Merle Carr Dr
- 120 Dolly Dr
- 117 Judith Dr
- 181 Hales Landing Rd
- 112 Judith Dr
- 126 Dolly Dr
- 125 Dolly Dr
- 116 W Judith Dr
- 235 Hales Landing Rd
- 116 Judith Dr
- 128 Judith Dr