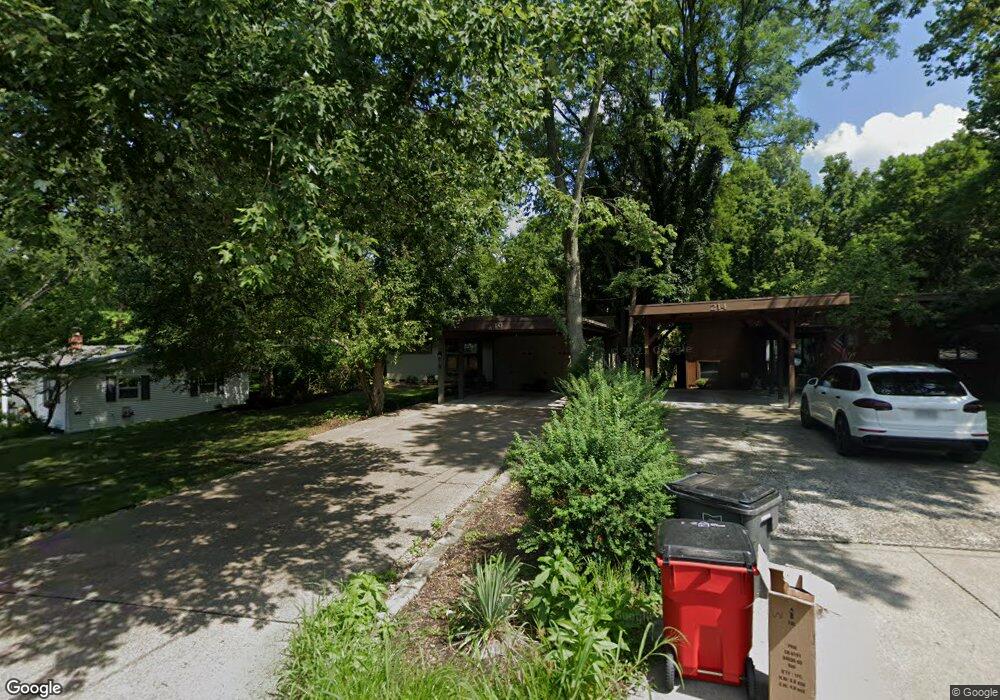
210 Hardy Way Worthington, OH 43085
Estimated Value: $509,000 - $635,000
3
Beds
2
Baths
2,050
Sq Ft
$286/Sq Ft
Est. Value
About This Home
This home is located at 210 Hardy Way, Worthington, OH 43085 and is currently estimated at $585,627, approximately $285 per square foot. 210 Hardy Way is a home located in Franklin County with nearby schools including Colonial Hills Elementary School, Kilbourne Middle School, and Thomas Worthington High School.
Ownership History
Date
Name
Owned For
Owner Type
Purchase Details
Closed on
Oct 29, 2021
Sold by
Norstrom David M and Norstrom Dorian B
Bought by
Norstrom David M and Norstrom Dorian B
Current Estimated Value
Purchase Details
Closed on
Jun 10, 2010
Sold by
Fetzer Leslie J and The Bank Of New York Mellon
Bought by
Norstrom David M and Norstrom Dorian B
Purchase Details
Closed on
Aug 8, 2000
Sold by
Baker Mary Louise
Bought by
Fetzer Leslie J
Create a Home Valuation Report for This Property
The Home Valuation Report is an in-depth analysis detailing your home's value as well as a comparison with similar homes in the area
Home Values in the Area
Average Home Value in this Area
Purchase History
| Date | Buyer | Sale Price | Title Company |
|---|---|---|---|
| Norstrom David M | -- | None Available | |
| Norstrom David M | $225,000 | None Available | |
| Fetzer Leslie J | $190,000 | Preferred Title Agency Inc |
Source: Public Records
Tax History Compared to Growth
Tax History
| Year | Tax Paid | Tax Assessment Tax Assessment Total Assessment is a certain percentage of the fair market value that is determined by local assessors to be the total taxable value of land and additions on the property. | Land | Improvement |
|---|---|---|---|---|
| 2024 | $9,851 | $155,230 | $51,940 | $103,290 |
| 2023 | $9,434 | $155,225 | $51,940 | $103,285 |
| 2022 | $8,883 | $116,800 | $32,550 | $84,250 |
| 2021 | $8,299 | $116,800 | $32,550 | $84,250 |
| 2020 | $7,921 | $116,800 | $32,550 | $84,250 |
| 2019 | $7,398 | $98,740 | $32,550 | $66,190 |
| 2018 | $3,587 | $98,740 | $32,550 | $66,190 |
| 2017 | $6,557 | $97,340 | $32,550 | $64,790 |
| 2016 | $6,414 | $87,790 | $33,360 | $54,430 |
| 2015 | $3,208 | $87,790 | $33,360 | $54,430 |
| 2014 | $6,413 | $87,790 | $33,360 | $54,430 |
| 2013 | $2,901 | $79,800 | $30,310 | $49,490 |
Source: Public Records
Map
Nearby Homes
- 264 E South St
- 254 E Selby Blvd
- 5584 Morning St
- 5818 Crescent Ct
- 675 Plymouth St
- 292 Chase Rd
- 503 Meadoway Park
- 510 Kenbrook Dr
- 551 Oxford St
- 562 Loveman Ave
- 5681 Indianola Ave
- 544 N Selby Blvd
- 143 W South St
- 5542 Emerson Ave
- 559 E Lincoln Ave
- 33 Rosslyn Ave
- 365 Pinney Dr
- 5495 Worthington Forest Place E
- 5475 Worthington Forest Place E Unit 5475
- 930 Proprietors Rd
- 214 Hardy Way
- 150 Brookside Oval
- 206 Hardy Way
- 160 Brookside Oval
- 218 Colonial Ave
- 212 Colonial Ave
- 204 Park Blvd
- 224 Colonial Ave
- 240 Hardy Way
- 230 Colonial Ave
- 186 Park Blvd
- 236 Colonial Ave
- 5791 Foster Ave
- 5830 Granby St
- 5850 Granby St
- 5820 Granby St
- 244 Colonial Ave
- 500 Evergreen Cir
- 5798 Granby St
- 234 Park Blvd