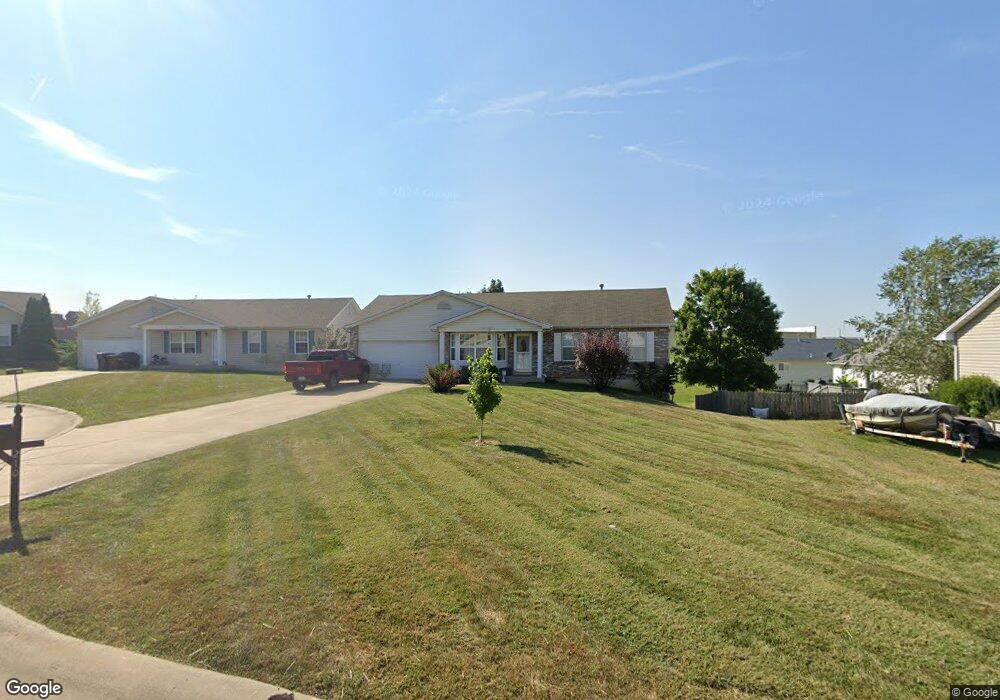
210 Hawks Rest Ct Winfield, MO 63389
Estimated Value: $246,000 - $257,000
4
Beds
3
Baths
1,135
Sq Ft
$222/Sq Ft
Est. Value
About This Home
This home is located at 210 Hawks Rest Ct, Winfield, MO 63389 and is currently estimated at $251,492, approximately $221 per square foot. 210 Hawks Rest Ct is a home located in Lincoln County with nearby schools including Winfield Primary School, Winfield Intermediate School, and Winfield Middle School.
Ownership History
Date
Name
Owned For
Owner Type
Purchase Details
Closed on
May 6, 2013
Sold by
Wehde Richard C and Wehde Sara J
Bought by
Richard And Sara Wehde Revocable Trust
Current Estimated Value
Purchase Details
Closed on
Jul 3, 2012
Sold by
Taylor Larry and Taylor Joan
Bought by
Boyer Debra A
Home Financials for this Owner
Home Financials are based on the most recent Mortgage that was taken out on this home.
Original Mortgage
$92,800
Outstanding Balance
$64,149
Interest Rate
3.7%
Mortgage Type
New Conventional
Estimated Equity
$187,343
Purchase Details
Closed on
Dec 19, 2005
Sold by
Deverger Randal B
Bought by
Tayloe Larry and Tayloe Jean
Home Financials for this Owner
Home Financials are based on the most recent Mortgage that was taken out on this home.
Original Mortgage
$43,350
Interest Rate
6.3%
Mortgage Type
Credit Line Revolving
Create a Home Valuation Report for This Property
The Home Valuation Report is an in-depth analysis detailing your home's value as well as a comparison with similar homes in the area
Purchase History
| Date | Buyer | Sale Price | Title Company |
|---|---|---|---|
| Richard And Sara Wehde Revocable Trust | -- | None Available | |
| Boyer Debra A | -- | None Available | |
| Tayloe Larry | -- | None Available |
Source: Public Records
Mortgage History
| Date | Status | Borrower | Loan Amount |
|---|---|---|---|
| Open | Boyer Debra A | $92,800 | |
| Previous Owner | Tayloe Larry | $43,350 |
Source: Public Records
Tax History
| Year | Tax Paid | Tax Assessment Tax Assessment Total Assessment is a certain percentage of the fair market value that is determined by local assessors to be the total taxable value of land and additions on the property. | Land | Improvement |
|---|---|---|---|---|
| 2025 | $1,667 | $27,520 | $2,894 | $24,626 |
| 2024 | $1,559 | $25,738 | $2,894 | $22,844 |
| 2023 | $1,563 | $25,737 | $2,894 | $22,844 |
| 2022 | $1,484 | $24,600 | $2,894 | $21,706 |
| 2021 | $1,490 | $129,470 | $0 | $0 |
| 2020 | $1,278 | $113,630 | $0 | $0 |
| 2019 | $1,280 | $113,630 | $0 | $0 |
| 2018 | $1,304 | $21,746 | $0 | $0 |
| 2017 | $1,308 | $21,746 | $0 | $0 |
| 2016 | $1,216 | $19,678 | $0 | $0 |
| 2015 | $1,223 | $19,678 | $0 | $0 |
| 2014 | $1,223 | $19,857 | $0 | $0 |
| 2013 | -- | $19,857 | $0 | $0 |
Source: Public Records
Map
Nearby Homes
- 220 Kitson Rd
- 212 Old Troy Rd
- Lot #21 West Ave
- 40+/- Pieper Rd
- 1585 S Highway 79
- 671 Birkhead Rd
- 25 Rolfes Ln
- 40+/- Acres Pieper Rd
- 389 Highway Y
- 0 Pillsbury Rd
- 35 Woodline Dr
- 3 Winfield Plaza
- 30 Sandy Creek Dr
- 69 Walnut Grove Dr
- 845 Highway Ee
- 157 Mcclay Rd
- 19 Hurt Dr
- 00 Pillsbury Rd
- 485 Pillsbury Rd
- 72 Justus Ln
- 220 Hawks Rest Ct
- 200 Hawks Rest Ct
- 150 Falcon Way
- 160 Falcon Way
- 230 Hawks Rest Ct
- 211 Hawks Rest Ct
- 221 Hawks Rest Ct
- 241 Hawks Rest Ct
- 201 Hawks Rest Ct
- 231 Hawks Rest Ct
- 141 Falcon Way
- 151 Falcon Way
- 131 Falcon Way
- 161 Falcon Way
- 51 Highland Rd
- 41 Highland Rd
- 171 Falcon Way
- 61 Highland Rd
- 31 Highland Rd
- 111 Falcon Way
Your Personal Tour Guide
Ask me questions while you tour the home.