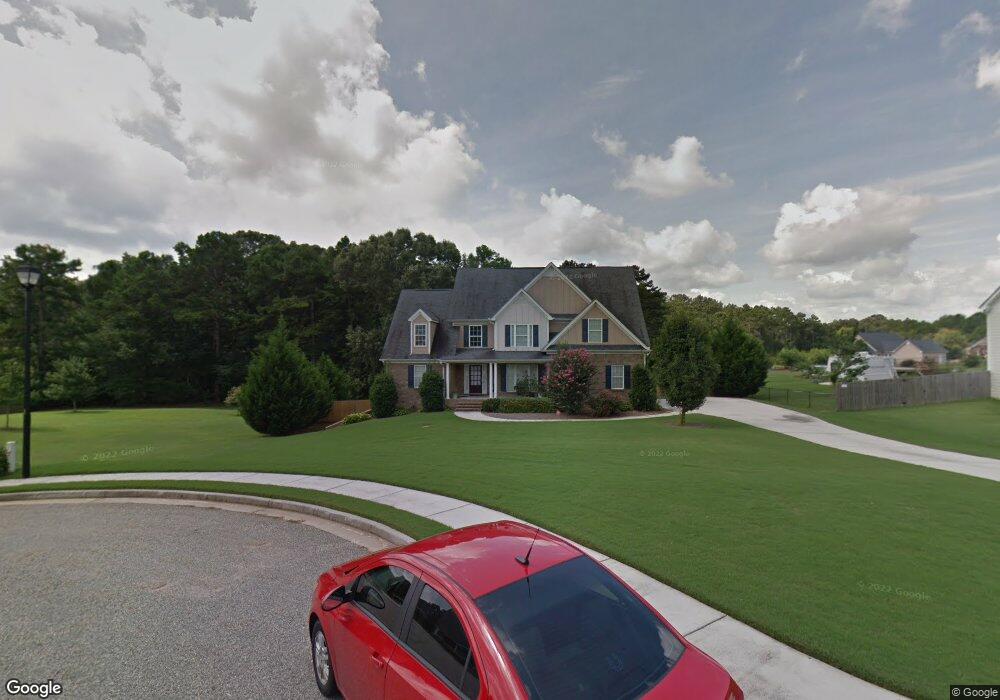
210 Helene Way Jefferson, GA 30549
Estimated Value: $423,422 - $539,000
--
Bed
3
Baths
2,662
Sq Ft
$178/Sq Ft
Est. Value
About This Home
This home is located at 210 Helene Way, Jefferson, GA 30549 and is currently estimated at $474,356, approximately $178 per square foot. 210 Helene Way is a home located in Jackson County with nearby schools including Jefferson Elementary School, Jefferson Academy, and Jefferson Middle School.
Ownership History
Date
Name
Owned For
Owner Type
Purchase Details
Closed on
Dec 29, 2006
Sold by
Not Provided
Bought by
Parker Bruce and Parker Kimberly
Current Estimated Value
Home Financials for this Owner
Home Financials are based on the most recent Mortgage that was taken out on this home.
Original Mortgage
$206,400
Outstanding Balance
$122,312
Interest Rate
6.06%
Mortgage Type
New Conventional
Estimated Equity
$352,044
Purchase Details
Closed on
Jun 28, 2005
Sold by
Green Greg
Bought by
Keith Chitwood Builders Inc
Home Financials for this Owner
Home Financials are based on the most recent Mortgage that was taken out on this home.
Original Mortgage
$370,000
Interest Rate
5.54%
Mortgage Type
New Conventional
Purchase Details
Closed on
Apr 12, 2005
Sold by
Whitetail Developers Llc
Bought by
Green Greg
Purchase Details
Closed on
Jan 19, 2005
Sold by
Whitetail Developers Llc
Bought by
Green Greg
Create a Home Valuation Report for This Property
The Home Valuation Report is an in-depth analysis detailing your home's value as well as a comparison with similar homes in the area
Home Values in the Area
Average Home Value in this Area
Purchase History
| Date | Buyer | Sale Price | Title Company |
|---|---|---|---|
| Parker Bruce | $258,000 | -- | |
| Keith Chitwood Builders Inc | $91,000 | -- | |
| Green Greg | $1,014,000 | -- | |
| Green Greg | $39,000 | -- |
Source: Public Records
Mortgage History
| Date | Status | Borrower | Loan Amount |
|---|---|---|---|
| Open | Parker Bruce | $206,400 | |
| Previous Owner | Keith Chitwood Builders Inc | $370,000 |
Source: Public Records
Tax History Compared to Growth
Tax History
| Year | Tax Paid | Tax Assessment Tax Assessment Total Assessment is a certain percentage of the fair market value that is determined by local assessors to be the total taxable value of land and additions on the property. | Land | Improvement |
|---|---|---|---|---|
| 2024 | $4,554 | $166,400 | $20,800 | $145,600 |
| 2023 | $4,573 | $149,440 | $20,800 | $128,640 |
| 2022 | $3,997 | $124,920 | $20,800 | $104,120 |
| 2021 | $3,886 | $119,320 | $15,200 | $104,120 |
| 2020 | $3,518 | $101,000 | $15,200 | $85,800 |
| 2019 | $3,570 | $101,000 | $15,200 | $85,800 |
| 2018 | $3,454 | $97,000 | $15,200 | $81,800 |
| 2017 | $3,314 | $91,203 | $15,200 | $76,003 |
| 2016 | $3,285 | $90,003 | $14,000 | $76,003 |
| 2015 | $3,195 | $87,203 | $11,200 | $76,003 |
| 2014 | $3,054 | $82,573 | $11,200 | $71,373 |
| 2013 | -- | $82,573 | $11,200 | $71,373 |
Source: Public Records
Map
Nearby Homes
- 273 Hickory Hills Dr
- 345 Hickory Hills Dr
- 750 Jett Roberts Rd
- 176 Village Dr
- 352 Lakeshore Dr
- 1681 Jett Roberts Rd
- 222 Jett Roberts Rd
- 194 Georgia 82 N
- 955 Georgia 82 N
- Tract 1 Georgia 82 N
- 1945 Georgia 82 N
- 17 Castleview Ct
- 1354 Washington St
- 1817 Jett Roberts Rd
- 1841 Jett Roberts Rd
- 865 Elder Dr
- 430 Katherine Dr
- 206 Blue Dragon Dr
- 445 Katherine Dr
- 196 Helene Way
- 168 Helene Way
- 226 Helene Way
- 59 Arthur Ave
- 253 Hickory Hills Dr
- 0 Hickory Hills Dr Unit 8096950
- 8 Hickory Hills Dr
- 41 Arthur Ave
- 193 Helene Way
- 221 Helene Way
- 71 Arthur Ave
- 19 Arthur Ave
- 209 Helene Way
- 132 Helene Way
- 132 Helene Way Unit LOT 10
- 177 Helene Way
- 296 Hickory Hills Dr
- 157 Helene Way
- 328 Hickory Hills Dr
- 0 Arthur Ave Unit CM921633