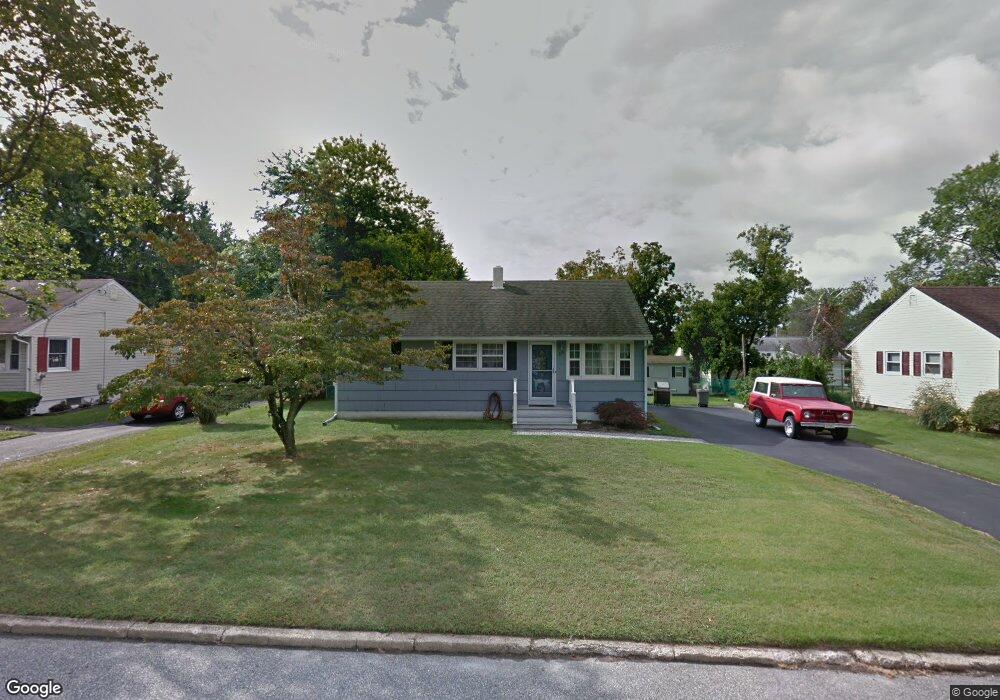
210 Hemlock Dr Neptune, NJ 07753
Estimated Value: $504,000 - $546,000
3
Beds
1
Bath
952
Sq Ft
$550/Sq Ft
Est. Value
About This Home
This home is located at 210 Hemlock Dr, Neptune, NJ 07753 and is currently estimated at $523,488, approximately $549 per square foot. 210 Hemlock Dr is a home located in Monmouth County with nearby schools including Neptune High School and Montessori Academy Of New Jersey.
Ownership History
Date
Name
Owned For
Owner Type
Purchase Details
Closed on
Dec 21, 2009
Sold by
Marshall Marie and Sharin Greg
Bought by
Sharin Marie and Sharin Gregory
Current Estimated Value
Home Financials for this Owner
Home Financials are based on the most recent Mortgage that was taken out on this home.
Original Mortgage
$230,000
Outstanding Balance
$149,634
Interest Rate
4.85%
Mortgage Type
New Conventional
Estimated Equity
$373,854
Purchase Details
Closed on
Aug 30, 2005
Sold by
Rosengrant Llewellyn West
Bought by
Sharin Greg and Marshall Marie
Home Financials for this Owner
Home Financials are based on the most recent Mortgage that was taken out on this home.
Original Mortgage
$265,100
Interest Rate
5.81%
Purchase Details
Closed on
Jan 14, 2003
Sold by
Rosengrant Cecelia
Bought by
Rosengrant Llewellyn
Home Financials for this Owner
Home Financials are based on the most recent Mortgage that was taken out on this home.
Original Mortgage
$121,500
Interest Rate
5.94%
Create a Home Valuation Report for This Property
The Home Valuation Report is an in-depth analysis detailing your home's value as well as a comparison with similar homes in the area
Home Values in the Area
Average Home Value in this Area
Purchase History
| Date | Buyer | Sale Price | Title Company |
|---|---|---|---|
| Sharin Marie | -- | Black Page Title Agency Inc | |
| Sharin Greg | $331,400 | -- | |
| Rosengrant Llewellyn | $135,000 | -- |
Source: Public Records
Mortgage History
| Date | Status | Borrower | Loan Amount |
|---|---|---|---|
| Open | Sharin Marie | $230,000 | |
| Closed | Sharin Greg | $265,100 | |
| Previous Owner | Rosengrant Llewellyn | $121,500 |
Source: Public Records
Tax History
| Year | Tax Paid | Tax Assessment Tax Assessment Total Assessment is a certain percentage of the fair market value that is determined by local assessors to be the total taxable value of land and additions on the property. | Land | Improvement |
|---|---|---|---|---|
| 2025 | $6,199 | $429,600 | $282,500 | $147,100 |
| 2024 | $5,882 | $354,000 | $222,800 | $131,200 |
Source: Public Records
Map
Nearby Homes
- 7 Schoolhouse Rd
- 26 Pinebrook Dr
- 109 Elm Dr
- 25 Penny Ln
- 65 Penny Ln
- 73 Penny Ln
- 67 Penny Ln
- 63 Penny Ln
- 69 Penny Ln
- 43 Victoria Gardens Square
- 31 Victoria Gardens Square
- 46 Victoria Gardens Square
- 42 Victoria Gardens Square
- 35 Victoria Gardens Square
- 37 Victoria Gardens Square
- 39 Victoria Gardens Square
- 41 Victoria Gardens Square
- 44 Victoria Gardens Square
- 48 Victoria Gardens Square
- 52 Victoria Gardens Square
Your Personal Tour Guide
Ask me questions while you tour the home.