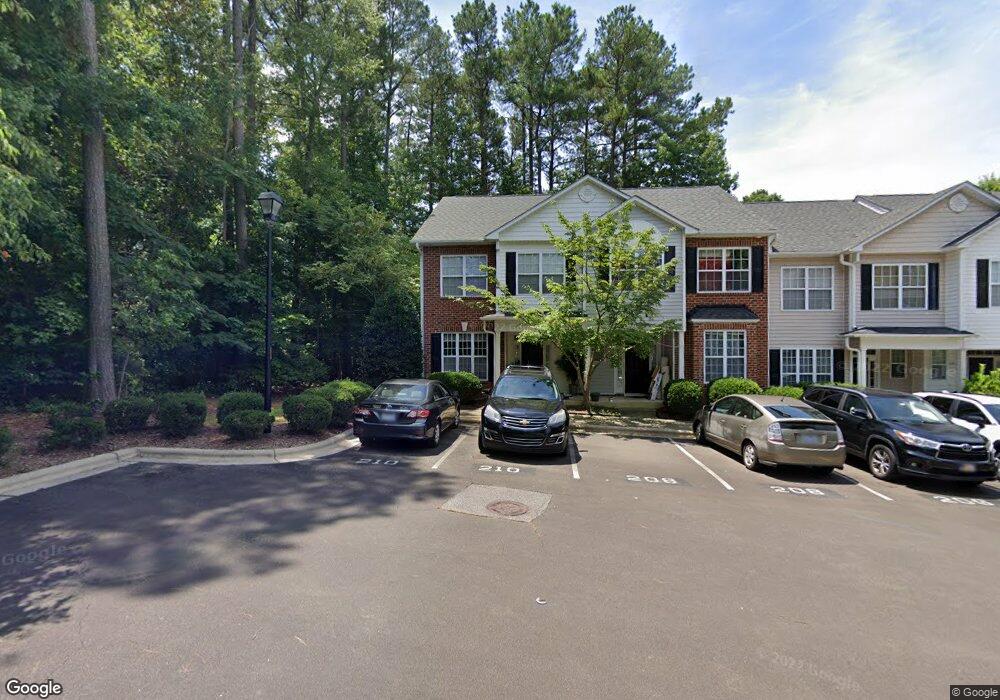
210 Hosta Lilly Ct Cary, NC 27513
North Cary NeighborhoodEstimated Value: $307,000 - $328,000
3
Beds
3
Baths
1,300
Sq Ft
$246/Sq Ft
Est. Value
About This Home
This home is located at 210 Hosta Lilly Ct, Cary, NC 27513 and is currently estimated at $320,089, approximately $246 per square foot. 210 Hosta Lilly Ct is a home located in Wake County with nearby schools including Northwoods Elementary School, West Cary Middle School, and Cary High School.
Ownership History
Date
Name
Owned For
Owner Type
Purchase Details
Closed on
Dec 17, 2013
Sold by
Pelkey Joshua R
Bought by
Muita Alice Njoki and Mureithi Charles Muita
Current Estimated Value
Home Financials for this Owner
Home Financials are based on the most recent Mortgage that was taken out on this home.
Original Mortgage
$3,947
Outstanding Balance
$2,941
Interest Rate
4.13%
Mortgage Type
FHA
Estimated Equity
$317,148
Purchase Details
Closed on
Jun 10, 2009
Sold by
Pelkey Eric M
Bought by
Pelkey Joshua R
Home Financials for this Owner
Home Financials are based on the most recent Mortgage that was taken out on this home.
Original Mortgage
$125,681
Interest Rate
4.77%
Mortgage Type
FHA
Purchase Details
Closed on
May 26, 2005
Sold by
Pendersmith Llc
Bought by
Pelkey Eric M
Home Financials for this Owner
Home Financials are based on the most recent Mortgage that was taken out on this home.
Original Mortgage
$129,500
Interest Rate
6.35%
Mortgage Type
Fannie Mae Freddie Mac
Create a Home Valuation Report for This Property
The Home Valuation Report is an in-depth analysis detailing your home's value as well as a comparison with similar homes in the area
Home Values in the Area
Average Home Value in this Area
Purchase History
| Date | Buyer | Sale Price | Title Company |
|---|---|---|---|
| Muita Alice Njoki | $134,000 | Chicago Title Insurance Co | |
| Pelkey Joshua R | $128,000 | None Available | |
| Pelkey Eric M | $129,500 | -- |
Source: Public Records
Mortgage History
| Date | Status | Borrower | Loan Amount |
|---|---|---|---|
| Open | Muita Alice Njoki | $3,947 | |
| Previous Owner | Pelkey Joshua R | $125,681 | |
| Previous Owner | Pelkey Eric M | $129,500 |
Source: Public Records
Tax History
| Year | Tax Paid | Tax Assessment Tax Assessment Total Assessment is a certain percentage of the fair market value that is determined by local assessors to be the total taxable value of land and additions on the property. | Land | Improvement |
|---|---|---|---|---|
| 2025 | $2,865 | $331,948 | $115,000 | $216,948 |
| 2024 | $2,803 | $331,948 | $115,000 | $216,948 |
Source: Public Records
Map
Nearby Homes
- 8704 Chapel Hill Rd
- 223 Adams St
- 103 Briarcreek Ct
- 507 Maple St
- 930 Madison Ave
- 404 W Chatham St
- 410 W Chatham St
- 317 White Oak Dr
- 412 W Chatham St
- 414 W Chatham St
- 120 Boyd St
- 401 W Chatham St
- 413 W Chatham St
- 411 W Chatham St
- 316 Williams St
- 415 W Chatham St
- 101 Oscar Ln
- 763 Samuel Cary Dr
- 844 Madison Ave
- 135 Boldleaf Ct
- 210 Hosta Lily Ct
- 208 Hosta Lily Ct
- 208 Hosta Lilly Ct
- 206 Hosta Lily Ct
- 206 Hosta Lilly Ct
- 204 Hosta Lily Ct
- 204 Hosta Lilly Ct
- 202 Hosta Lily Ct
- 202 Hosta Lilly Ct
- 200 Hosta Lily Ct
- 200 Hosta Lilly Ct
- 111 Star Thistle Ln
- 8708 Chapel Hill Rd
- 109 Star Thistle Ln
- 107 Star Thistle Ln
- 8718 Chapel Hill Rd
- 105 Star Thistle Ln
- 124 Star Thistle Ln
- 122 Star Thistle Ln
- 128 Star Thistle Ln
Your Personal Tour Guide
Ask me questions while you tour the home.