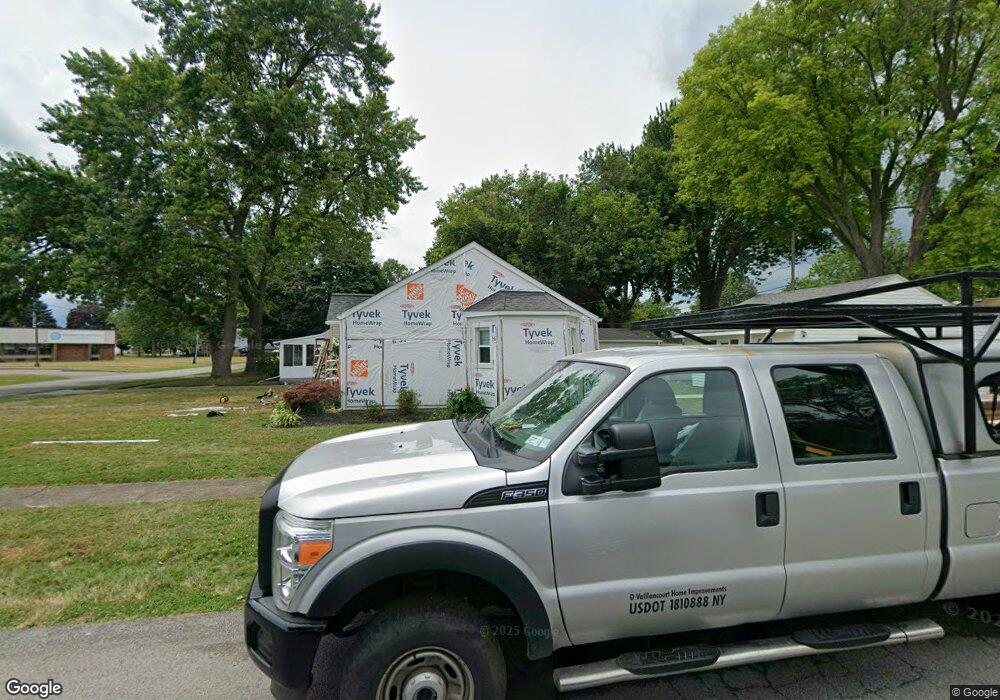
210 Humphrey St North Tonawanda, NY 14120
Estimated Value: $136,000 - $185,000
2
Beds
1
Bath
776
Sq Ft
$216/Sq Ft
Est. Value
About This Home
This home is located at 210 Humphrey St, North Tonawanda, NY 14120 and is currently estimated at $167,918, approximately $216 per square foot. 210 Humphrey St is a home located in Niagara County with nearby schools including North Tonawanda Intermediate School, St Matthew Lutheran School, and New Life Christian School.
Ownership History
Date
Name
Owned For
Owner Type
Purchase Details
Closed on
Aug 25, 2009
Sold by
Brinson Lorraine
Bought by
Barrett Brenda
Current Estimated Value
Home Financials for this Owner
Home Financials are based on the most recent Mortgage that was taken out on this home.
Original Mortgage
$66,610
Outstanding Balance
$43,386
Interest Rate
5.19%
Mortgage Type
FHA
Estimated Equity
$124,532
Purchase Details
Closed on
Aug 20, 2009
Sold by
Brinson Lorraine
Bought by
Barrett Brenda
Home Financials for this Owner
Home Financials are based on the most recent Mortgage that was taken out on this home.
Original Mortgage
$66,610
Outstanding Balance
$43,386
Interest Rate
5.19%
Mortgage Type
FHA
Estimated Equity
$124,532
Purchase Details
Closed on
Jul 29, 2005
Sold by
Arbour - Estate Of Anastasia
Bought by
Brinson Lorraine
Create a Home Valuation Report for This Property
The Home Valuation Report is an in-depth analysis detailing your home's value as well as a comparison with similar homes in the area
Home Values in the Area
Average Home Value in this Area
Purchase History
| Date | Buyer | Sale Price | Title Company |
|---|---|---|---|
| Barrett Brenda | $67,840 | Rupp | |
| Barrett Brenda | $67,840 | None Available | |
| Brinson Lorraine | $63,000 | Daniel E Brick |
Source: Public Records
Mortgage History
| Date | Status | Borrower | Loan Amount |
|---|---|---|---|
| Open | Barrett Brenda | $66,610 |
Source: Public Records
Tax History Compared to Growth
Tax History
| Year | Tax Paid | Tax Assessment Tax Assessment Total Assessment is a certain percentage of the fair market value that is determined by local assessors to be the total taxable value of land and additions on the property. | Land | Improvement |
|---|---|---|---|---|
| 2024 | $2,581 | $73,100 | $16,500 | $56,600 |
| 2023 | $2,517 | $73,100 | $16,500 | $56,600 |
| 2022 | $2,041 | $73,100 | $16,500 | $56,600 |
| 2021 | $2,001 | $73,100 | $16,500 | $56,600 |
| 2020 | $1,912 | $73,100 | $16,500 | $56,600 |
| 2019 | $1,002 | $73,100 | $16,500 | $56,600 |
| 2018 | $1,847 | $73,100 | $16,500 | $56,600 |
| 2017 | $1,793 | $73,100 | $16,500 | $56,600 |
| 2016 | $1,727 | $73,100 | $16,500 | $56,600 |
| 2015 | -- | $73,100 | $16,500 | $56,600 |
| 2014 | -- | $73,100 | $16,500 | $56,600 |
Source: Public Records
Map
Nearby Homes