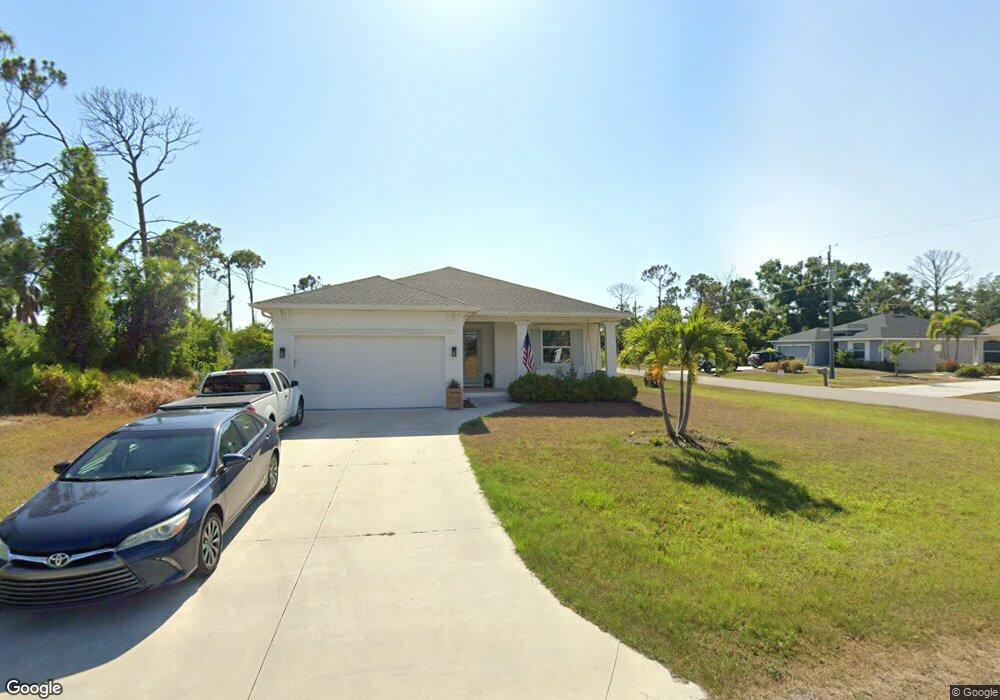
210 Jade St Rotonda West, FL 33947
Estimated Value: $340,000 - $382,256
--
Bed
2
Baths
1,602
Sq Ft
$228/Sq Ft
Est. Value
About This Home
This home is located at 210 Jade St, Rotonda West, FL 33947 and is currently estimated at $365,314, approximately $228 per square foot. 210 Jade St is a home located in Charlotte County with nearby schools including Myakka River Elementary School, L.A. Ainger Middle School, and Lemon Bay High School.
Ownership History
Date
Name
Owned For
Owner Type
Purchase Details
Closed on
Oct 11, 2018
Sold by
Srq Port Charlotte Llc
Bought by
Shand Brian and Shand Christena J
Current Estimated Value
Home Financials for this Owner
Home Financials are based on the most recent Mortgage that was taken out on this home.
Original Mortgage
$139,900
Outstanding Balance
$122,001
Interest Rate
4.5%
Mortgage Type
New Conventional
Estimated Equity
$243,313
Purchase Details
Closed on
Jul 2, 2018
Sold by
Trb Rls Development Llc
Bought by
Srq Port Charlotte Llc
Purchase Details
Closed on
Feb 20, 2017
Sold by
Schramm Alexander
Bought by
Trb Rls Development Llc
Purchase Details
Closed on
Mar 31, 2005
Sold by
Ratcliff Haven A and Potts Ricky Lee
Bought by
Schramm Alexander
Purchase Details
Closed on
Oct 20, 2004
Sold by
Nda Land Acquisitions Llc
Bought by
Ratcliff Haven A and Potts Ricky Lee
Purchase Details
Closed on
Sep 19, 2003
Sold by
Marnell Roger A
Bought by
N D A Land Acquisitions L L C
Create a Home Valuation Report for This Property
The Home Valuation Report is an in-depth analysis detailing your home's value as well as a comparison with similar homes in the area
Home Values in the Area
Average Home Value in this Area
Purchase History
| Date | Buyer | Sale Price | Title Company |
|---|---|---|---|
| Shand Brian | $229,900 | Attorney | |
| Srq Port Charlotte Llc | $50,000 | Attorney | |
| Trb Rls Development Llc | $20,000 | Attorney | |
| Schramm Alexander | $45,000 | Bay Title Services | |
| Ratcliff Haven A | $37,000 | Westco Title Services Inc | |
| N D A Land Acquisitions L L C | $9,500 | -- |
Source: Public Records
Mortgage History
| Date | Status | Borrower | Loan Amount |
|---|---|---|---|
| Open | Shand Brian | $139,900 |
Source: Public Records
Tax History Compared to Growth
Tax History
| Year | Tax Paid | Tax Assessment Tax Assessment Total Assessment is a certain percentage of the fair market value that is determined by local assessors to be the total taxable value of land and additions on the property. | Land | Improvement |
|---|---|---|---|---|
| 2023 | $3,403 | $210,849 | $0 | $0 |
| 2022 | $3,332 | $208,498 | $0 | $0 |
| 2021 | $3,330 | $202,425 | $0 | $0 |
| 2020 | $3,272 | $199,630 | $0 | $0 |
| 2019 | $3,875 | $197,053 | $8,075 | $188,978 |
| 2018 | $343 | $9,350 | $9,350 | $0 |
| 2017 | $301 | $9,350 | $9,350 | $0 |
| 2016 | $282 | $4,698 | $0 | $0 |
| 2015 | $277 | $4,271 | $0 | $0 |
| 2014 | $257 | $3,883 | $0 | $0 |
Source: Public Records
Map
Nearby Homes
- 141 Hobo Rd
- 320 Albatross Rd
- 130 Australian Dr
- 126 Australian Dr
- 210 Albatross Rd
- 373 Albatross Rd
- 145 Green Pine Park
- 128 Lantana Rd
- 118 Green Pine Park
- 124 Green Pine Park
- 168 Green Oak Park
- 153 Green Oak Park
- 168 White Pine Dr
- 146 Baytree Dr
- 103 Gem Ct
- 177 Baytree Dr
- 184 Jade St
- 154 Baytree Dr Unit Lot 27
- 160 Baytree Dr
- 138 White Pine Dr
- 137 Hobo Rd
- 310 Albatross Rd
- 211 Jade St
- 316 Albatross Rd
- 207 Jade St
- 202 Jade St
- 318 Albatross Rd
- 205 Jade St
- 133 Hobo Rd
- 168 Green Pine Park
- 172 Green Pine Park
- 200 Jade St
- 166 Green Pine Park
- 138 Hobo Rd
- 174 Green Pine Park
- 131 Hobo Rd
- 164 Green Pine Park
- 136 Hobo Rd
- 322 Albatross Rd
- 302 Albatross Rd