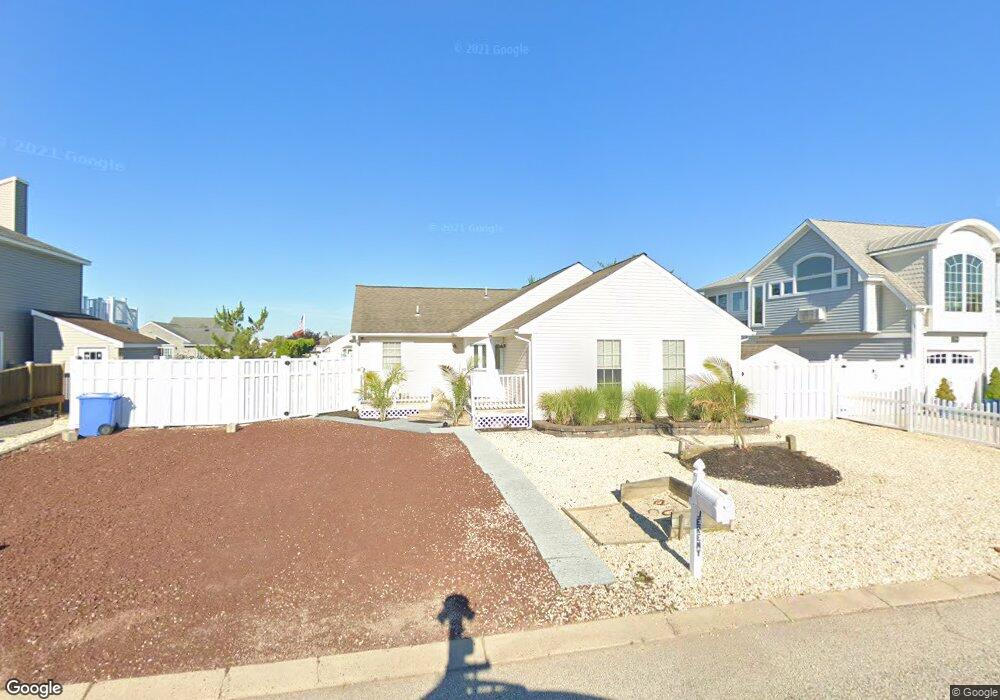
210 Jeremy Ln Manahawkin, NJ 08050
Stafford NeighborhoodEstimated Value: $509,000 - $998,658
3
Beds
2
Baths
1,144
Sq Ft
$668/Sq Ft
Est. Value
About This Home
This home is located at 210 Jeremy Ln, Manahawkin, NJ 08050 and is currently estimated at $763,915, approximately $667 per square foot. 210 Jeremy Ln is a home located in Ocean County with nearby schools including Oxycocus Elementary School, Ocean Acres Elementary School, and McKinley Avenue Elementary School.
Ownership History
Date
Name
Owned For
Owner Type
Purchase Details
Closed on
Sep 13, 2004
Sold by
Dimauro Gennaro and Di Mauro Laura A
Bought by
Mezzacappa Anthony and Mezzacappa Phyllis
Current Estimated Value
Home Financials for this Owner
Home Financials are based on the most recent Mortgage that was taken out on this home.
Original Mortgage
$386,910
Outstanding Balance
$207,688
Interest Rate
7.15%
Mortgage Type
Fannie Mae Freddie Mac
Estimated Equity
$556,227
Create a Home Valuation Report for This Property
The Home Valuation Report is an in-depth analysis detailing your home's value as well as a comparison with similar homes in the area
Home Values in the Area
Average Home Value in this Area
Purchase History
| Date | Buyer | Sale Price | Title Company |
|---|---|---|---|
| Mezzacappa Anthony | $429,900 | Lawyers Title Ins |
Source: Public Records
Mortgage History
| Date | Status | Borrower | Loan Amount |
|---|---|---|---|
| Open | Mezzacappa Anthony | $386,910 |
Source: Public Records
Tax History Compared to Growth
Tax History
| Year | Tax Paid | Tax Assessment Tax Assessment Total Assessment is a certain percentage of the fair market value that is determined by local assessors to be the total taxable value of land and additions on the property. | Land | Improvement |
|---|---|---|---|---|
| 2025 | $13,202 | $531,700 | $198,700 | $333,000 |
| 2024 | $13,075 | $531,700 | $198,700 | $333,000 |
| 2023 | $12,516 | $531,700 | $198,700 | $333,000 |
| 2022 | $7,436 | $315,900 | $198,700 | $117,200 |
| 2021 | $7,356 | $316,800 | $198,700 | $118,100 |
| 2020 | $7,366 | $316,800 | $198,700 | $118,100 |
| 2019 | $7,261 | $316,800 | $198,700 | $118,100 |
| 2018 | $7,217 | $316,800 | $198,700 | $118,100 |
| 2017 | $6,958 | $295,700 | $179,800 | $115,900 |
| 2016 | $6,887 | $295,700 | $179,800 | $115,900 |
| 2015 | $6,644 | $295,700 | $179,800 | $115,900 |
| 2014 | $6,563 | $288,500 | $177,400 | $111,100 |
Source: Public Records
Map
Nearby Homes