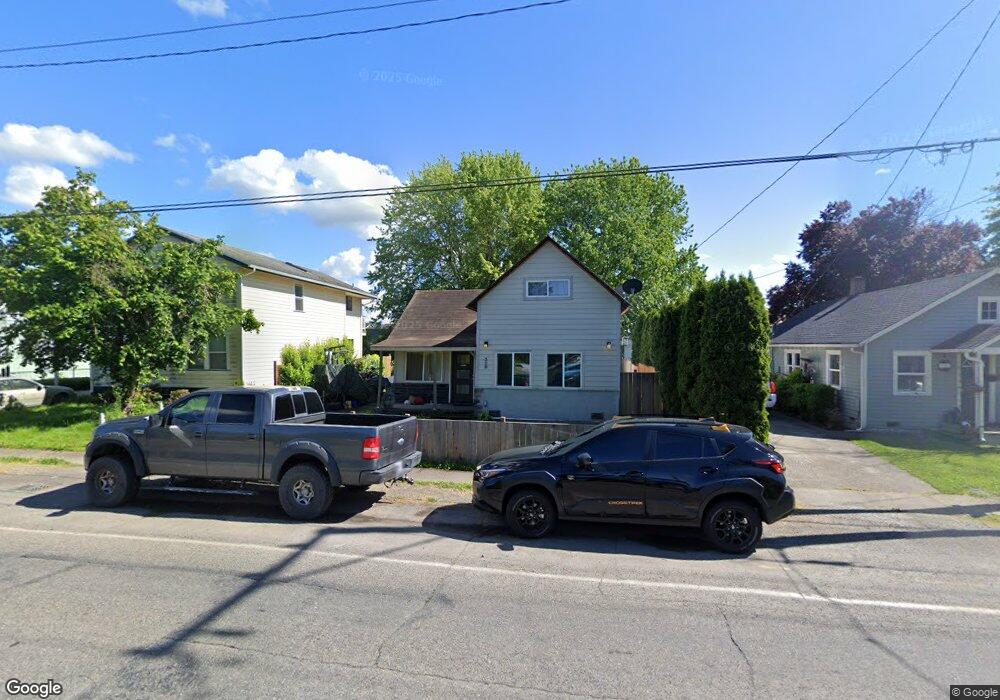
210 Kansas St SW Orting, WA 98360
Estimated Value: $431,739 - $460,000
3
Beds
1
Bath
1,440
Sq Ft
$310/Sq Ft
Est. Value
About This Home
This home is located at 210 Kansas St SW, Orting, WA 98360 and is currently estimated at $446,685, approximately $310 per square foot. 210 Kansas St SW is a home with nearby schools including Orting Elementary School, Ptarmigan Ridge Elementary School, and Orting Middle School.
Ownership History
Date
Name
Owned For
Owner Type
Purchase Details
Closed on
Dec 29, 2006
Sold by
Hawkins Danielle C
Bought by
Acosta Ramiro
Current Estimated Value
Home Financials for this Owner
Home Financials are based on the most recent Mortgage that was taken out on this home.
Original Mortgage
$222,028
Outstanding Balance
$152,297
Interest Rate
9.05%
Mortgage Type
Balloon
Estimated Equity
$294,388
Purchase Details
Closed on
Jul 3, 2006
Sold by
Haskey Justin P and Donarski Suzanne M
Bought by
Hawkins Danielle C
Home Financials for this Owner
Home Financials are based on the most recent Mortgage that was taken out on this home.
Original Mortgage
$133,200
Interest Rate
7.87%
Mortgage Type
Unknown
Purchase Details
Closed on
Sep 21, 2004
Sold by
Cowan Johanna M
Bought by
Haskey Justin P and Donarski Suzanne M
Home Financials for this Owner
Home Financials are based on the most recent Mortgage that was taken out on this home.
Original Mortgage
$152,703
Interest Rate
5.8%
Mortgage Type
FHA
Create a Home Valuation Report for This Property
The Home Valuation Report is an in-depth analysis detailing your home's value as well as a comparison with similar homes in the area
Home Values in the Area
Average Home Value in this Area
Purchase History
We collect this data history from publicly available records. To have your information removed, we recommend requesting removal directly through your county’s website.
| Date | Buyer | Sale Price | Title Company |
|---|---|---|---|
| Acosta Ramiro | $246,697 | Ticor | |
| Hawkins Danielle C | $166,500 | First American Title Ins Co | |
| Haskey Justin P | $133,316 | Ticor |
Source: Public Records
Mortgage History
We collect this data history from publicly available records. To have your information removed, we recommend requesting removal directly through your county’s website.
| Date | Status | Borrower | Loan Amount |
|---|---|---|---|
| Open | Acosta Ramiro | $222,028 | |
| Previous Owner | Hawkins Danielle C | $133,200 | |
| Previous Owner | Haskey Justin P | $152,703 |
Source: Public Records
Tax History
| Year | Tax Paid | Tax Assessment Tax Assessment Total Assessment is a certain percentage of the fair market value that is determined by local assessors to be the total taxable value of land and additions on the property. | Land | Improvement |
|---|---|---|---|---|
| 2025 | $3,170 | $361,400 | $181,100 | $180,300 |
| 2024 | $3,170 | $357,700 | $171,600 | $186,100 |
| 2023 | $3,170 | $332,800 | $163,900 | $168,900 |
| 2022 | $2,973 | $332,500 | $163,900 | $168,600 |
| 2021 | $2,823 | $232,900 | $107,900 | $125,000 |
| 2019 | $2,486 | $207,500 | $91,500 | $116,000 |
| 2018 | $2,300 | $192,700 | $79,800 | $112,900 |
| 2017 | $2,300 | $167,300 | $64,100 | $103,200 |
| 2016 | $2,109 | $135,700 | $50,200 | $85,500 |
| 2014 | $1,740 | $125,800 | $44,900 | $80,900 |
| 2013 | $1,740 | $103,600 | $35,200 | $68,400 |
Source: Public Records
Map
Nearby Homes
- 335 Belfair St SW
- 528 Harman Way S
- 213 Bridge St SW
- 211 Bridge St SW
- 506 Belfair Ct SW
- 836 Harman Way S Unit 62
- 836 Harman Way S Unit 73
- 836 Harman Way S Unit 82
- 836 Harman Way S Unit 76
- 836 Harman Way S Unit 33
- 120 Corrin Ave NW
- 404 Factory St SE
- 307 Bridge St SE
- 210 Silver Ln SE
- 716 Teetor Cir NW Unit Lot 08
- 517 Cope St SW
- 718 Teetor Cir NW Unit LOT 9
- 708 Teetor Cir NW Unit LOT 4
- 215 Corrin Ave NW Unit C
- 215 Corrin Ave NW Unit B
- 302 Kansas St SW
- 208 Kansas St SW
- 304 Kansas St SW
- 206 Kansas St SW
- 306 Kansas St SW
- 204 Kansas St SW
- 411 Eldredge Ave SW
- 412 Eldredge Ave SW
- 202 Kansas St SW
- 410 Eldredge Ave SW
- 409 Eldredge Ave SW
- 207 Kansas St SW Unit A-B
- 207 Kansas St SW
- 307 Kansas St SW
- 310 Kansas St SW
- 205 Kansas St SW
- 408 Eldredge Ave SW
- 110 Kansas St SW
- 309 Kansas St SW
- 506 Grinnell Ave SW
Your Personal Tour Guide
Ask me questions while you tour the home.