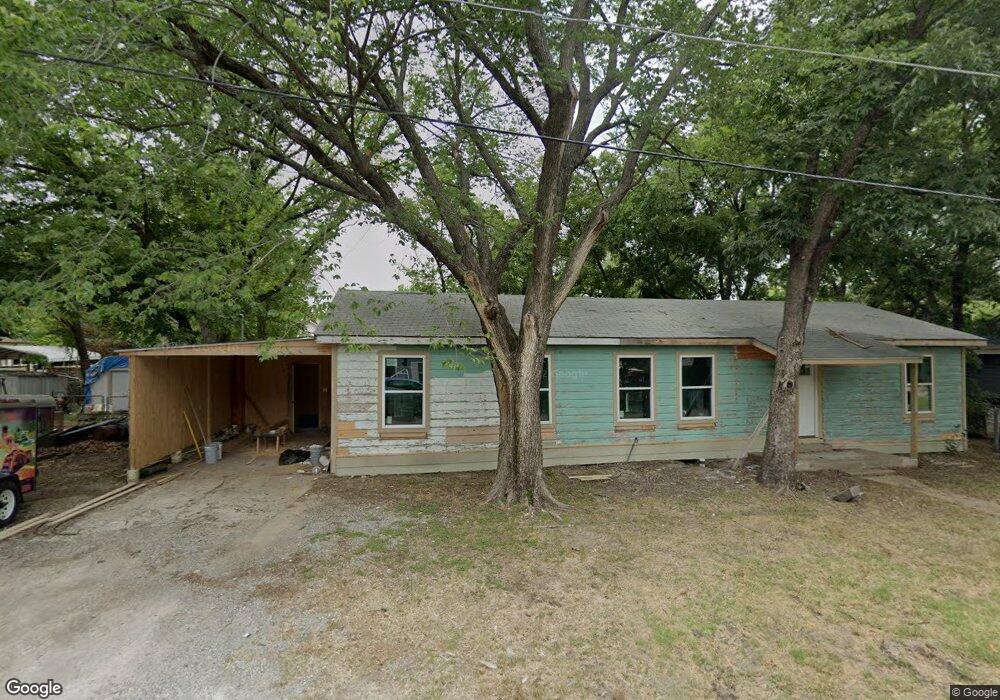
210 Kelly St Bonham, TX 75418
Estimated Value: $161,435 - $182,000
--
Bed
--
Bath
1,325
Sq Ft
$129/Sq Ft
Est. Value
About This Home
This home is located at 210 Kelly St, Bonham, TX 75418 and is currently estimated at $170,859, approximately $128 per square foot. 210 Kelly St is a home located in Fannin County with nearby schools including Finley-Oates Elementary School, LH Rather Jr High School, and Morning Star Academy.
Ownership History
Date
Name
Owned For
Owner Type
Purchase Details
Closed on
Jan 13, 2022
Sold by
Country Village Investments Llc
Bought by
Essary Investments Llc
Current Estimated Value
Purchase Details
Closed on
Feb 5, 2016
Sold by
Wooten Roger and Wooten Tarasa
Bought by
Ba Residential Llc
Home Financials for this Owner
Home Financials are based on the most recent Mortgage that was taken out on this home.
Original Mortgage
$12,750
Interest Rate
4.05%
Mortgage Type
New Conventional
Purchase Details
Closed on
Jul 16, 1976
Sold by
Carter Creta Lynn
Bought by
Country Village Investments Ll
Create a Home Valuation Report for This Property
The Home Valuation Report is an in-depth analysis detailing your home's value as well as a comparison with similar homes in the area
Home Values in the Area
Average Home Value in this Area
Purchase History
| Date | Buyer | Sale Price | Title Company |
|---|---|---|---|
| Essary Investments Llc | -- | Robertson & Simpson Pllc | |
| Ba Residential Llc | -- | Cole Title Company | |
| Country Village Investments Ll | -- | Cole Title |
Source: Public Records
Mortgage History
| Date | Status | Borrower | Loan Amount |
|---|---|---|---|
| Previous Owner | Ba Residential Llc | $12,750 |
Source: Public Records
Tax History Compared to Growth
Tax History
| Year | Tax Paid | Tax Assessment Tax Assessment Total Assessment is a certain percentage of the fair market value that is determined by local assessors to be the total taxable value of land and additions on the property. | Land | Improvement |
|---|---|---|---|---|
| 2025 | $3,213 | $142,280 | $36,480 | $105,800 |
| 2024 | $3,213 | $165,659 | $36,240 | $129,419 |
| 2023 | $2,958 | $150,000 | $23,650 | $126,350 |
| 2022 | $1,606 | $73,040 | $17,390 | $55,650 |
| 2021 | $1,360 | $53,800 | $8,940 | $44,860 |
| 2020 | $874 | $34,190 | $6,320 | $27,870 |
| 2019 | $1,220 | $45,902 | $3,710 | $42,192 |
| 2018 | $971 | $36,600 | $3,710 | $32,890 |
| 2017 | $974 | $38,090 | $3,710 | $34,380 |
| 2016 | $958 | $37,480 | $3,710 | $33,770 |
| 2015 | -- | $32,340 | $3,590 | $28,750 |
| 2014 | -- | $34,030 | $3,530 | $30,500 |
Source: Public Records
Map
Nearby Homes