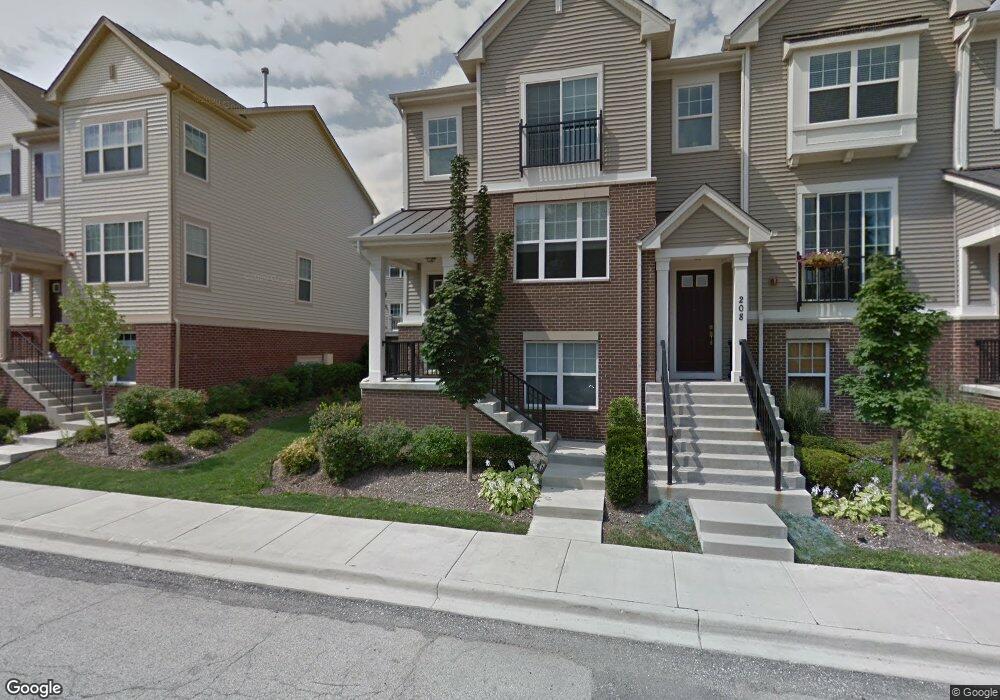
210 Laurel Ave Unit 8-1 Des Plaines, IL 60016
Estimated Value: $423,000 - $460,000
3
Beds
3
Baths
1,913
Sq Ft
$231/Sq Ft
Est. Value
About This Home
This home is located at 210 Laurel Ave Unit 8-1, Des Plaines, IL 60016 and is currently estimated at $442,807, approximately $231 per square foot. 210 Laurel Ave Unit 8-1 is a home located in Cook County with nearby schools including North Elementary School, Chippewa Middle School, and Maine West High School.
Ownership History
Date
Name
Owned For
Owner Type
Purchase Details
Closed on
May 18, 2020
Sold by
Desalvo James Donald and Desalvo Melanie Erin
Bought by
Bogildea Nicolae A and Bogildea Ludmila
Current Estimated Value
Home Financials for this Owner
Home Financials are based on the most recent Mortgage that was taken out on this home.
Original Mortgage
$308,460
Interest Rate
2.9%
Mortgage Type
New Conventional
Purchase Details
Closed on
Feb 26, 2015
Sold by
Tran Jay and Tran Jamie A
Bought by
Desalvo James Donald
Home Financials for this Owner
Home Financials are based on the most recent Mortgage that was taken out on this home.
Original Mortgage
$291,127
Interest Rate
3.37%
Mortgage Type
VA
Purchase Details
Closed on
Mar 1, 2009
Sold by
Lexington Des Plaines I Llc
Bought by
Tran Jay and Tran Jamie A
Home Financials for this Owner
Home Financials are based on the most recent Mortgage that was taken out on this home.
Original Mortgage
$317,149
Interest Rate
5.11%
Mortgage Type
FHA
Create a Home Valuation Report for This Property
The Home Valuation Report is an in-depth analysis detailing your home's value as well as a comparison with similar homes in the area
Home Values in the Area
Average Home Value in this Area
Purchase History
| Date | Buyer | Sale Price | Title Company |
|---|---|---|---|
| Bogildea Nicolae A | $318,000 | Prairie Title | |
| Desalvo James Donald | $292,000 | Old Republic Natl Title Ins | |
| Tran Jay | $323,000 | Cti |
Source: Public Records
Mortgage History
| Date | Status | Borrower | Loan Amount |
|---|---|---|---|
| Previous Owner | Bogildea Nicolae A | $308,460 | |
| Previous Owner | Desalvo James Donald | $291,127 | |
| Previous Owner | Tran Jay | $317,149 |
Source: Public Records
Tax History Compared to Growth
Tax History
| Year | Tax Paid | Tax Assessment Tax Assessment Total Assessment is a certain percentage of the fair market value that is determined by local assessors to be the total taxable value of land and additions on the property. | Land | Improvement |
|---|---|---|---|---|
| 2024 | $8,090 | $34,000 | $5,500 | $28,500 |
| 2023 | $8,748 | $34,000 | $5,500 | $28,500 |
| 2022 | $8,748 | $34,000 | $5,500 | $28,500 |
| 2021 | $8,021 | $26,095 | $800 | $25,295 |
| 2020 | $6,948 | $26,095 | $800 | $25,295 |
| 2019 | $6,880 | $28,995 | $800 | $28,195 |
| 2018 | $7,201 | $27,513 | $708 | $26,805 |
| 2017 | $7,091 | $27,513 | $708 | $26,805 |
| 2016 | $6,951 | $27,513 | $708 | $26,805 |
| 2015 | $6,827 | $25,206 | $616 | $24,590 |
| 2014 | $6,699 | $25,206 | $616 | $24,590 |
| 2013 | $6,515 | $25,206 | $616 | $24,590 |
Source: Public Records
Map
Nearby Homes
- 1245 Evergreen Ave
- 1279 Harding Ave Unit 3B
- 1279 Harding Ave Unit 2B
- 1433 Willow Ave
- 1258 Brown St Unit 302
- 395 Graceland Ave Unit 207
- 394 Alles St Unit 3B
- 1108 Evergreen Ave
- 1363 Brown St Unit 3C
- 430 Oak St
- 476 Alles St Unit 210
- 1363 Perry St Unit 1B
- 184 Lilah Ct
- 182 Lilah Ct
- 182 Eli Ct
- 1389 Perry St Unit 303
- 431 Oak St
- 501 Alles St Unit 501A
- 555 Graceland Ave Unit 206
- 550 Ida St Unit 2NW
- 210 Laurel Ave
- 208 Laurel Ave
- 206 Laurel Ave
- 214 Laurel Ave
- 216 Laurel Ave
- 1256 Evergreen Ave
- 1258 Evergreen Ave
- 1254 Evergreen Ave
- 1254 Evergreen Ave Unit 7
- 1260 Evergreen Ave
- 1260 Evergreen Ave Unit 11-4
- 202 Laurel Ave
- 1262 Evergreen Ave
- 1239 Willow Ave
- 218 Laurel Ave
- 1264 Evergreen Ave
- 1305 Willow Ave
- 220 Laurel Ave
- 1266 Evergreen Ave
- 222 Laurel Ave