Estimated Value: $138,284 - $190,000
3
Beds
1
Bath
1,178
Sq Ft
$134/Sq Ft
Est. Value
About This Home
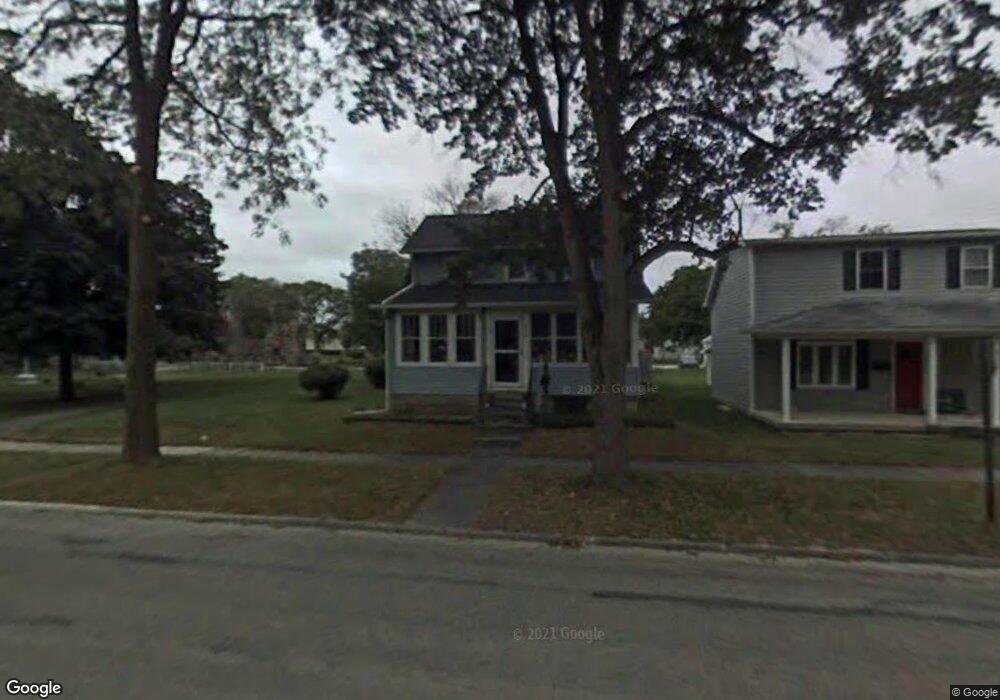
This home is located at 210 Main St, Genoa, OH 43430 and is currently estimated at $157,321, approximately $133 per square foot. 210 Main St is a home located in Ottawa County with nearby schools including Genoa Elementary School and Community Christian Academy.
Ownership History
Date
Name
Owned For
Owner Type
Purchase Details
Closed on
Apr 25, 2006
Sold by
Ragland Arlene G
Bought by
Ragland Dale F and Ragland Arlene G
Current Estimated Value
Home Financials for this Owner
Home Financials are based on the most recent Mortgage that was taken out on this home.
Original Mortgage
$73,500
Outstanding Balance
$42,869
Interest Rate
6.62%
Mortgage Type
New Conventional
Estimated Equity
$114,452
Purchase Details
Closed on
Nov 13, 1995
Sold by
Holcombe Timothy J
Bought by
Ragland Arlene G
Home Financials for this Owner
Home Financials are based on the most recent Mortgage that was taken out on this home.
Original Mortgage
$50,240
Interest Rate
7.7%
Mortgage Type
New Conventional
Purchase Details
Closed on
Nov 29, 1994
Sold by
Est Wilma V Norwalk
Bought by
Doyle Danny R and Doyle Billie Jo
Purchase Details
Closed on
Oct 22, 1993
Sold by
Luebke Thos W and Luebke Joanne M
Bought by
Holcombe Timothy J And
Create a Home Valuation Report for This Property
The Home Valuation Report is an in-depth analysis detailing your home's value as well as a comparison with similar homes in the area
Purchase History
| Date | Buyer | Sale Price | Title Company |
|---|---|---|---|
| Ragland Dale F | -- | Richmond Title Services Lp | |
| Ragland Arlene G | $62,800 | -- | |
| Doyle Danny R | $5,500 | -- | |
| Holcombe Timothy J And | $44,400 | -- |
Source: Public Records
Mortgage History
| Date | Status | Borrower | Loan Amount |
|---|---|---|---|
| Open | Ragland Dale F | $73,500 | |
| Previous Owner | Ragland Arlene G | $50,240 |
Source: Public Records
Tax History
| Year | Tax Paid | Tax Assessment Tax Assessment Total Assessment is a certain percentage of the fair market value that is determined by local assessors to be the total taxable value of land and additions on the property. | Land | Improvement |
|---|---|---|---|---|
| 2024 | $1,760 | $35,319 | $8,523 | $26,796 |
| 2023 | $1,585 | $30,751 | $7,105 | $23,646 |
| 2022 | $1,552 | $30,751 | $7,105 | $23,646 |
| 2021 | $1,367 | $30,760 | $7,110 | $23,650 |
| 2020 | $1,163 | $24,610 | $4,900 | $19,710 |
| 2019 | $1,158 | $24,610 | $4,900 | $19,710 |
| 2018 | $1,130 | $24,610 | $4,900 | $19,710 |
| 2017 | $1,237 | $24,680 | $4,900 | $19,780 |
| 2016 | $1,241 | $24,680 | $4,900 | $19,780 |
| 2015 | $1,224 | $24,680 | $4,900 | $19,780 |
| 2014 | $506 | $21,960 | $4,900 | $17,060 |
| 2013 | $1,016 | $21,960 | $4,900 | $17,060 |
Source: Public Records
Map
Nearby Homes
- 304 Main St
- 108 W 8th St
- 904 Main St
- 915 Buckeye St
- 416 Castle Cove
- 207 E 11th St
- 1216 Main St
- 1309 Superior St
- 21682 State Route 51 W
- 1320 Superior St
- 23526 W Manor Dr
- 0 Recker Rd
- 1861 N Opfer-Lentz Rd
- 330 5th St
- 19079 W Orchard Dr
- 26810 Woodland Ct
- 26931 W Woodland Ct
- 1001 Oak St
- 1005 W College Ave
- 620 Water St
Your Personal Tour Guide
Ask me questions while you tour the home.