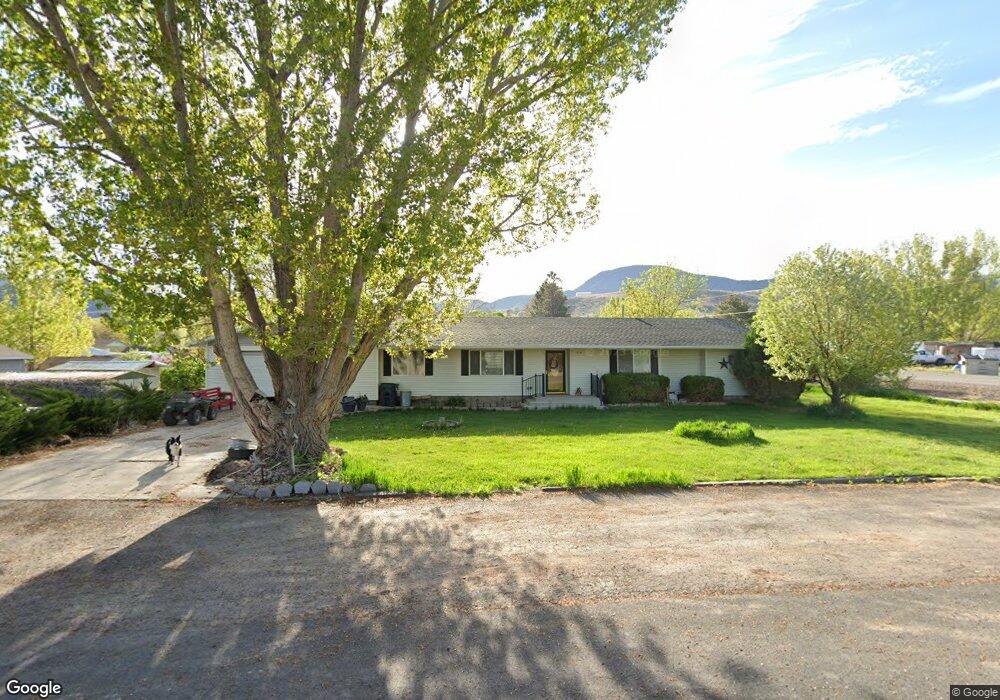
210 N 100 E Glenwood, UT 84730
Estimated Value: $383,674 - $424,000
3
Beds
2
Baths
1,966
Sq Ft
$207/Sq Ft
Est. Value
About This Home
This home is located at 210 N 100 E, Glenwood, UT 84730 and is currently estimated at $407,169, approximately $207 per square foot. 210 N 100 E is a home located in Sevier County with nearby schools including Pahvant School, Ashman School, and Red Hills Middle School.
Ownership History
Date
Name
Owned For
Owner Type
Purchase Details
Closed on
Jan 29, 2024
Sold by
Rippstein Ryder K and Rippstein Mackayla A
Bought by
Christensen Courtney and Christensen Tyler
Current Estimated Value
Home Financials for this Owner
Home Financials are based on the most recent Mortgage that was taken out on this home.
Original Mortgage
$355,443
Outstanding Balance
$348,560
Interest Rate
6.95%
Mortgage Type
FHA
Estimated Equity
$58,609
Purchase Details
Closed on
Apr 30, 2019
Sold by
Erickson Ronald K
Bought by
Rippstein Ryder K and Rippstein Mackayla A
Home Financials for this Owner
Home Financials are based on the most recent Mortgage that was taken out on this home.
Original Mortgage
$207,000
Interest Rate
4.2%
Purchase Details
Closed on
Mar 17, 2008
Sold by
Erickson Ronald K and Erickson Dosena June
Bought by
Erickson Ronald K and Erickson Dosena J
Create a Home Valuation Report for This Property
The Home Valuation Report is an in-depth analysis detailing your home's value as well as a comparison with similar homes in the area
Purchase History
| Date | Buyer | Sale Price | Title Company |
|---|---|---|---|
| Christensen Courtney | -- | First American Title | |
| Rippstein Ryder K | -- | Professional Title | |
| Erickson Ronald K | -- | None Available |
Source: Public Records
Mortgage History
| Date | Status | Borrower | Loan Amount |
|---|---|---|---|
| Open | Christensen Courtney | $355,443 | |
| Previous Owner | Rippstein Ryder K | $207,000 |
Source: Public Records
Tax History
| Year | Tax Paid | Tax Assessment Tax Assessment Total Assessment is a certain percentage of the fair market value that is determined by local assessors to be the total taxable value of land and additions on the property. | Land | Improvement |
|---|---|---|---|---|
| 2025 | $1,560 | $184,797 | $72,729 | $112,068 |
| 2024 | $1,560 | $191,699 | $68,995 | $122,704 |
| 2023 | $1,648 | $188,470 | $47,878 | $140,592 |
| 2022 | $1,539 | $155,057 | $47,537 | $107,520 |
| 2021 | $1,402 | $117,343 | $34,541 | $82,802 |
| 2020 | $1,532 | $120,277 | $26,796 | $93,481 |
| 2019 | $1,130 | $94,750 | $26,800 | $67,950 |
| 2018 | $1,182 | $88,720 | $26,800 | $61,920 |
| 2017 | $1,094 | $77,860 | $22,330 | $55,530 |
| 2016 | $740 | $77,860 | $0 | $0 |
| 2015 | $740 | $73,260 | $0 | $0 |
| 2014 | $740 | $73,260 | $0 | $0 |
Source: Public Records
Map
Nearby Homes
- 140 N 200 E
- 110 N 400 E
- 60 S Main St
- 1526 N Black Knoll Rd
- 145 N Venice Main St
- 931 N 2270 E
- 1200 N Blackknoll Rd E
- 1800 N Vermillion Canal Rd
- 2890 N 2330 E Unit 1
- 375 N 800 E
- 701 S Black Knoll Rd Unit 4
- 651 E 800 N
- 56 S 500 E
- 442 E Center St
- 662 E 300 N
- 227 E 300 N
- 342 N 500 E
- 333 N 300 E
- 66 S State St
- 0 Parcel #4-241-82 Unit 26-271167
Your Personal Tour Guide
Ask me questions while you tour the home.