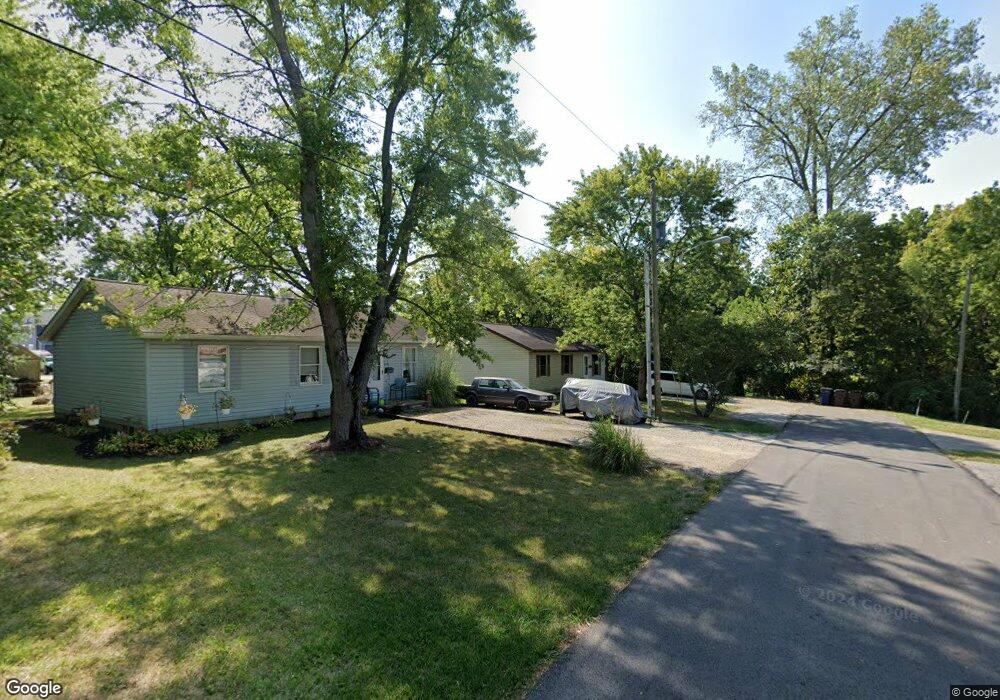
210 N Buchanan St Baltimore, OH 43105
Estimated Value: $202,810 - $223,000
3
Beds
1
Bath
1,000
Sq Ft
$217/Sq Ft
Est. Value
About This Home
This home is located at 210 N Buchanan St, Baltimore, OH 43105 and is currently estimated at $217,453, approximately $217 per square foot. 210 N Buchanan St is a home located in Fairfield County with nearby schools including Liberty Union Elementary School, Liberty Union Middle School, and Liberty Union High School.
Ownership History
Date
Name
Owned For
Owner Type
Purchase Details
Closed on
Oct 28, 2009
Sold by
Price Mary E and Price Ronald Lee
Bought by
Fowler Garrett W
Current Estimated Value
Home Financials for this Owner
Home Financials are based on the most recent Mortgage that was taken out on this home.
Original Mortgage
$93,886
Outstanding Balance
$61,523
Interest Rate
5.07%
Mortgage Type
FHA
Estimated Equity
$155,930
Purchase Details
Closed on
Jul 15, 2005
Sold by
Hart Ellis
Bought by
Hart Mary E
Purchase Details
Closed on
Oct 2, 2003
Sold by
Hart Mary E and Hart Ellis
Bought by
Hart Ellis and Hart Mary E
Home Financials for this Owner
Home Financials are based on the most recent Mortgage that was taken out on this home.
Original Mortgage
$68,000
Interest Rate
6.49%
Mortgage Type
Purchase Money Mortgage
Create a Home Valuation Report for This Property
The Home Valuation Report is an in-depth analysis detailing your home's value as well as a comparison with similar homes in the area
Home Values in the Area
Average Home Value in this Area
Purchase History
| Date | Buyer | Sale Price | Title Company |
|---|---|---|---|
| Fowler Garrett W | $101,000 | Attorney | |
| Hart Mary E | -- | -- | |
| Hart Ellis | -- | -- |
Source: Public Records
Mortgage History
| Date | Status | Borrower | Loan Amount |
|---|---|---|---|
| Open | Fowler Garrett W | $93,886 | |
| Previous Owner | Hart Ellis | $68,000 |
Source: Public Records
Tax History Compared to Growth
Tax History
| Year | Tax Paid | Tax Assessment Tax Assessment Total Assessment is a certain percentage of the fair market value that is determined by local assessors to be the total taxable value of land and additions on the property. | Land | Improvement |
|---|---|---|---|---|
| 2024 | $3,007 | $40,060 | $5,460 | $34,600 |
| 2023 | $1,537 | $40,060 | $5,460 | $34,600 |
| 2022 | $1,524 | $40,060 | $5,460 | $34,600 |
| 2021 | $1,231 | $29,330 | $4,950 | $24,380 |
| 2020 | $1,259 | $29,330 | $4,950 | $24,380 |
| 2019 | $1,280 | $29,330 | $4,950 | $24,380 |
| 2018 | $1,112 | $23,360 | $4,950 | $18,410 |
| 2017 | $1,117 | $23,360 | $4,950 | $18,410 |
| 2016 | $1,101 | $23,360 | $4,950 | $18,410 |
| 2015 | $1,014 | $22,530 | $4,950 | $17,580 |
| 2014 | $973 | $22,530 | $4,950 | $17,580 |
| 2013 | $973 | $22,530 | $4,950 | $17,580 |
Source: Public Records
Map
Nearby Homes
- 301 N Oak St
- 118 N Oak St
- 308 N Basil St
- 409 N Basil St
- 111 N High St
- 238 N Company St
- 0 S Company St Unit Lot 2 225029545
- 0 S Company St Unit Lot 1 225029543
- 606 N Main St
- 214 E Cliff St
- 132 N Creekview Ct
- 133 N Creekview Ct
- 101 Circle Dr
- 113 Circle Dr
- 224 Baltimore Somerset Rd NE
- 1350 Leonard Rd NW
- 9730 Lancaster-Kirkersville Rd NW
- 570 Baltimore Somerset Rd NE Unit Lot 1
- 9585 Snyder Church Rd NW
- 6990 Bader Rd NW
- 230 N Buchanan St
- 220 N Buchanan St
- 1020 W Washington St
- 215 N Buchanan St
- 209 N Buchanan St
- 1025 W Kumler St
- 1015 W Kumler St
- 221 N Oak St
- 225 N Oak St
- 217 N Oak St
- 229 N Oak St
- 1105 W Kumler St
- 211 N Oak St
- 1100 W Washington St
- 1119 W Kumler St
- 237 N Oak St
- 201 N Oak St
- 1024 W Kumler St
- 1100 W Kumler St
- 1008 W Kumler St